89,99 €
Mehr erfahren.
- Herausgeber: John Wiley & Sons
- Kategorie: Wissenschaft und neue Technologien
- Serie: Wiley - IEEE
- Sprache: Englisch
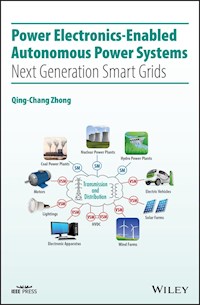
Power systems worldwide are going through a paradigm shift from centralized generation to distributed generation. This book presents the SYNDEM (i.e., synchronized and democratized) grid architecture and its technical routes to harmonize the integration of renewable energy sources, electric vehicles, storage systems, and flexible loads, with the synchronization mechanism of synchronous machines, to enable autonomous operation of power systems, and to promote energy freedom. This is a game changer for the grid. It is the sort of breakthrough — like the touch screen in smart phones — that helps to push an industry from one era to the next, as reported by Keith Schneider, a New York Times correspondent since 1982. This book contains an introductory chapter and additional 24 chapters in five parts: Theoretical Framework, First-Generation VSM (virtual synchronous machines), Second-Generation VSM, Third-Generation VSM, and Case Studies. Most of the chapters include experimental results.
As the first book of its kind for power electronics-enabled autonomous power systems, it
• introduces a holistic architecture applicable to both large and small power systems, including aircraft power systems, ship power systems, microgrids, and supergrids
• provides latest research to address the unprecedented challenges faced by power systems and to enhance grid stability, reliability, security, resiliency, and sustainability
• demonstrates how future power systems achieve harmonious interaction, prevent local faults from cascading into wide-area blackouts, and operate autonomously with minimized cyber-attacks
• highlights the significance of the SYNDEM concept for power systems and beyond
Power Electronics-Enabled Autonomous Power Systems is an excellent book for researchers, engineers, and students involved in energy and power systems, electrical and control engineering, and power electronics. The SYNDEM theoretical framework chapter is also suitable for policy makers, legislators, entrepreneurs, commissioners of utility commissions, energy and environmental agency staff, utility personnel, investors, consultants, and attorneys.
Sie lesen das E-Book in den Legimi-Apps auf:
Seitenzahl: 754
Veröffentlichungsjahr: 2020
Ähnliche


Table of Contents
Cover
List of Figures
List of Tables
Foreword
Preface
Acknowledgments
About the Author
List of Abbreviations
Chapter 1: Introduction
1.1 Motivation and Purpose
1.2 Outline of the Book
1.3 Evolution of Power Systems
1.4 Summary
Part I: Theoretical Framework
Chapter 2: Synchronized and Democratized (SYNDEM) Smart Grid
2.1 The SYNDEM Concept
2.2 SYNDEM Rule of Law – Synchronization Mechanism of Synchronous Machines
2.3 SYNDEM Legal Equality – Homogenizing Heterogeneous Players as Virtual Synchronous Machines (VSM)
2.4 SYNDEM Grid Architecture
2.5 Potential Benefits
2.6 Brief Description of Technical Routes
2.7 Primary Frequency Response (PFR) in a SYNDEM Smart Grid
2.8 SYNDEM Roots
2.9 Summary
Chapter 3: Ghost Power Theory
3.1 Introduction
3.2 Ghost Operator, Ghost Signal, and Ghost System
3.3 Physical Meaning of Reactive Power in Electrical Systems
3.4 Extension to Complete the Electrical‐Mechanical Analogy
3.5 Generalization to Other Energy Systems
3.6 Summary and Discussions
Part II: 1G VSM: Synchronverters
Chapter 4: Synchronverter Based Generation
4.1 Mathematical Model of Synchronous Generatorss
4.2 Implementation of a Synchronverter
4.3 Operation of a Synchronverter
4.4 Simulation Results
4.5 Experimental Results
4.6 Summary
Chapter 5: Synchronverter Based Loads
5.1 Introduction
5.2 Modeling of a Synchronous Motor
5.3 Operation of a PWM Rectifier as a VSM
5.4 Simulation Results
5.5 Experimental Results
5.6 Summary
Chapter 6: Control of Permanent Magnet Synchronous Generator (PMSG) Based Wind Turbines
6.1 Introduction
6.2 PMSG Based Wind Turbines
6.3 Control of the Rotor‐Side Converter
6.4 Control of the Grid‐Side Converter
6.5 Real‐time Simulation Results
6.6 Summary
Chapter 7: Synchronverter Based AC Ward Leonard Drive Systems
7.1 Introduction
7.2 Ward Leonard Drive Systems
7.3 Model of a Synchronous Generator
7.4 Control Scheme with a Speed Sensor
7.5 Control Scheme without a Speed Sensor
7.6 Experimental Results
7.7 Summary
Chapter 8: Synchronverter without a Dedicated Synchronization Unit
8.1 Introduction
8.2 Interaction of a Synchronous Generator (SG) with an Infinite Bus
8.3 Controller for a Self‐synchronized Synchronverter
8.4 Simulation Results
8.5 Experimental Results
8.6 Benefits of Removing the Synchronization Unit
8.7 Summary
Chapter 9: Synchronverter Based Loads without a Dedicated Synchronisation Unit
9.1 Controlling the DC‐bus Voltage
9.2 Controlling the Power
9.3 Simulation Results
9.4 Experimental Results
9.5 Summary
Chapter 10: Control of a DFIG Based Wind Turbine as a VSG (DFIG‐VSG)
10.1 Introduction
10.2 DFIG Based Wind Turbines
10.3 Differential Gears and Ancient Chinese South‐pointing Chariots
10.4 Analogy between a DFIG and Differential Gears
10.5 Control of a Grid‐side Converter
10.6 Control of the Rotor‐Side Converter
10.7 Regulation of System Frequency and Voltage
10.8 Simulation Results
10.9 Experimental Results
10.10 Summary
Chapter 11: Synchronverter Based Transformerless Photovoltaic Systems
11.1 Introduction
11.2 Leakage Currents and Grounding of Grid‐tied Converters
11.3 Operation of a Conventional Half‐bridge Inverter
11.4 A Transformerless PV Inverter
11.5 Real‐time Simulation Results
11.6 Summary
Chapter 12: Synchronverter Based STATCOM without an Dedicated Synchronization Unit
12.1 Introduction
12.2 Conventional Control of STATCOM
12.3 Synchronverter Based Control
12.4 Simulation Results
12.5 Summary
Chapter 13: Synchronverters with Bounded Frequency and Voltage
13.1 Introduction
13.2 Model of the Original Synchronverter
13.3 Achieving Bounded Frequency and Voltage
13.4 Real‐time Simulation Results
13.5 Summary
Chapter 14: Virtual Inertia, Virtual Damping, and Fault Ride‐through
14.1 Introduction
14.2 Inertia, the Inertia Time Constant, and the Inertia Constant
14.3 Limitation of the Inertia of a Synchronverter
14.4 Reconfiguration of the Inertia Time Constant
14.5 Reconfiguration of the Virtual Damping
14.6 Fault Ride‐through
14.7 Simulation Results
14.8 Experimental Results
14.9 Summary
Part III: 2G VSM: Robust Droop Controller
Chapter 15: Synchronization Mechanism of Droop Control
15.1 Brief Review of Phase‐Locked Loops (PLLs)
15.2 Brief Review of Droop Control
15.3 Structural Resemblance between Droop Control and PLL
15.4 Operation of a Droop Controller as a Synchronization Unit
15.5 Experimental Results
15.6 Summary
16 Robust Droop Control
16.1 Control of Inverter Output Impedance
16.2 Inherent Limitations of Conventional Droop Control
16.3 Robust Droop Control of R‐inverters
16.4 Robust Droop Control of C‐inverters
16.5 Robust Droop Control of L‐inverters
16.6 Summary
17 Universal Droop Control
17.1 Introduction
17.2 Further Insights into Droop Control
17.3 Universal Droop Controller
17.4 Real‐time Simulation Results
17.5 Experimental Results
17.6 Summary
18 Self‐synchronized Universal Droop Controller
18.1 Description of the Controller
18.2 Operation of the Controller
18.3 Experimental Results
18.4 Real‐time Simulation Results from a Microgrid
18.5 Summary
19 Droop‐Controlled Loads for Continuous Demand Response
19.1 Introduction
19.2 Control Framework with a Three‐port Converter
19.3 An Illustrative Implementation with the ‐converter
19.4 Experimental Results
19.5 Summary
20 Current‐limiting Universal Droop Controller
20.1 Introduction
20.2 System Modeling
20.3 Control Design
20.4 System Analysis
20.5 Practical Implementation
20.6 Operation under Grid Variations and Faults
20.7 Experimental Results
20.8 Summary
Part IV: 3G VSM: Cybersync Machines
21 Cybersync Machines
21.1 Introduction
21.2 Passivity and Port‐Hamiltonian Systems
21.3 System Modeling
21.4 Control Framework
21.5 Passivity of the Controller
21.6 Passivity of the Closed‐loop System
21.7 Sample Implementations for Blocks and
21.8 Self‐Synchronization and Power Regulation
21.9 Simulation Results
21.10 Experimental Results
21.11 Summary
Part V: Case Studies
22 A Single‐node System
22.1 SYNDEM Smart Grid Research and Educational Kit
22.2 Details of the Single‐Node SYNDEM System
22.3 Summary
23 A 100% Power Electronics Based SYNDEM Smart Grid Testbed
23.1 Description of the Testbed
23.2 Experimental Results
23.3 Summary
24 A Home Grid
24.1 Description of the Home Grid
24.2 Results from Field Operations
24.3 Unexpected Problems Emerged During the Field Trial
24.4 Summary
25 Texas Panhandle Wind Power System
25.1 Geographical Description
25.2 System Structure
25.3 Main Challenges
25.4 Overview of Control Strategies Compared
25.5 Simulation Results
25.6 Summary and Conclusions
Bibliography
Index
End User License Agreement
List of Tables
Chapter 1
Table 1.1 Comparison of today's grids, smart grids, and next‐generation smart gr...
Chapter 2
Table 2.1 Machines that power the industrial revolutions.
Chapter 3
Table 3.1 The electrical‐mechanical analogy based on the force–current analogy.
Chapter 4
Table 4.1 Parameters of the synchronverter for simulations.
Table 4.2 Parameters of VSG.
Table 4.3 Parameters of VSG2.
Chapter 5
Table 5.1 Parameters of the rectifier under simulation.
Chapter 6
Table 6.1 Parameters of a PMSG wind turbine system.
Table 6.2 GSC control parameters.
Table 6.3 RSC control parameters.
Chapter 7
Table 7.1 Comparison of different control strategies for AC VSDs.
Table 7.2 Parameters of the motor.
Chapter 8
Table 8.1 Operation modes of a self‐synchronized synchronverter.
Table 8.2 Parameters used in simulations and experiments.
Table 8.3 Impact on the complexity of the overall controller and the demand for ...
Chapter 9
Table 9.1 Parameters of the rectifier.
Table 9.2 Parameters for controlling the DC‐bus voltage.
Table 9.3 Parameters for controlling the the power.
Chapter 10
Table 10.1 Comparison of different wind power generation systems.
Table 10.2 Parameters of the DFIG‐VSG simulated.
Table 10.3 Parameters of the experimental DFIG system.
Chapter 11
Table 11.1 Operation modes of the PV inverter.
Table 11.2 Parameters of the system.
Chapter 12
Table 12.1 Operation modes of a STATCOM.
Chapter 13
Table 13.1 Parameters of a synchronverter.
Chapter 14
Table 14.1 Parameters of the system under simulation.
Chapter 15
Table 15.1 Operation modes.
Table 15.2 Parameters of the inverter.
Chapter 17
Table 17.1 Droop controllers for L‐, R‐, C‐,
‐, and
‐inverters.
Table 17.2 Steady‐state performance of the three inverters in parallel operat...
Chapter 18
Table 18.1 Operation modes of the self‐synchronized universal droop controlle...
Table 18.2 Parameters of the inverter.
Table 18.3 Parameters of the microgrid.
Chapter 19
Table 19.1 Parameters of the experimental droop‐controlled rectifier.
Chapter 20
Table 20.1 System and controller parameters.
Chapter 21
Table 21.1 Operation modes of the cybersync machine in Figure 21.7.
Table 21.2 Parameters of the cybersync machine under simulation.
Table 21.3 Parameters of the experimental cybersync machine.
Chapter 25
Table 25.1 Parameters of the back‐to‐back converters.
Table 25.2 Installed wind capacity in Panhandle.
Table 25.3 Parameters of 345 kV transmission lines.
Table 25.4 Comparison of export capabilities under different control strategi...
List of Illustrations
Chapter 1
Figure 1.1 Structure of the book.
Chapter 2
Figure 2.1 Examples of divisive opinions in a democratic society. (a) 2016 UK ...
Figure 2.2 The sinusoid‐locked loop (SLL) that explains the inherent synchroni...
Figure 2.3 Approximate electricity consumption in the US.
Figure 2.4 A two‐port virtual synchronous machine (VSM).
Figure 2.5 SYNDEM grid architecture based on the synchronization mechanism of ...
Figure 2.6 A SYNDEM home grid.
Figure 2.7 A SYNDEM neighbourhood grid.
Figure 2.8 A SYNDEM community grid.
Figure 2.9 A SYNDEM district grid.
Figure 2.10 A SYNDEM regional grid.
Figure 2.11 The iceberg of power system challenges and solutions.
Figure 2.12 The frequency regulation capability of a VSM connected the UK publ...
Chapter 3
Figure 3.1 Illustrations of the imaginary operator and the ghost operator. (a)...
Figure 3.2 The system pair that consists of the original system and its ghost....
Figure 3.3 Illustration of the ghost power theory.
Chapter 4
Figure 4.1 Structure of an idealized three‐phase round‐rotor synchronous gener...
Figure 4.2 The power part of a synchronverter is a basic inverter.
Figure 4.3 The electronic part of a synchronverter without control.
Figure 4.4 The electronic part of a synchronverter with the function of freque...
Figure 4.5 Operation of a synchronverter under different grid frequencies (lef...
Figure 4.6 Experimental setup with two synchronverters. (a) System structure. ...
Figure 4.7 Experimental results in the set mode: output currents with 2.25 kW ...
Figure 4.8 Experimental results in the set mode: output currents (left column)...
Figure 4.9 Experimental results in the droop mode: primary frequency response.
Figure 4.10 Experimental results: the currents of the grid, VSG, and VSG2 unde...
Figure 4.11 Real power
and reactive power
during the change in the operati...
Figure 4.12 Transient responses of the synchronverter. (a) Transfer from grid‐...
Chapter 5
Figure 5.1 Structure of an idealized three‐phase round‐rotor synchronous motor...
Figure 5.2 The model of a synchronous motor.
Figure 5.3 PWM rectifier treated as a virtual synchronous motor.
Figure 5.4 Directly controlling the power of a rectifier.
Figure 5.5 Controlling the DC‐bus voltage of a rectifier.
Figure 5.6 Simulation results when controlling the power. (a) Grid and interna...
Figure 5.7 Simulation results when controlling the DC‐bus voltage. (a) Grid an...
Figure 5.8 Experimental results when controlling the power. (a) Grid and inter...
Figure 5.9 Experimental results when controlling the DC‐bus voltage. (a) Grid ...
Chapter 6
Figure 6.1 Integration of a PMSG wind turbine into the grid through back‐to‐ba...
Figure 6.2 Controller for the RSC.
Figure 6.3 Controller for the GSC.
Figure 6.4 Dynamic response of the GSC. (a) Full simulation process. (b) Volta...
Figure 6.5 Dynamic response of the RSC. (a) Full simulation process. (b) Volta...
Figure 6.6 Real‐time simulation results with a grid fault appearing at
s for...
Chapter 7
Figure 7.1 Conventional (DC) Ward Leonard drive system.
Figure 7.2 AC Ward Leonard drive system. (a) Natural implementation. (b) Virtu...
Figure 7.3 Mathematical model of a synchronous generator.
Figure 7.4 Control structure for an AC WLDS with a speed sensor.
Figure 7.5 Control structure for an AC WLDS without a speed sensor.
Figure 7.6 An experimental AC drive.
Figure 7.7 Reversal from a high speed without a load. (a) Speed. (b) Torque of...
Figure 7.8 Reversal from a high speed with a load. (a) Speed. (b) Torque of th...
Figure 7.9 Reversal from a low speed without a load. (a) Speed. (b) Torque of ...
Figure 7.10 Reversal from a low speed with a load. (a) Speed. (b) Torque of th...
Figure 7.11 Reversal at an extremely low speed without a load. (a) Speed. (b) ...
Figure 7.12 Reversal from a high speed without a load (without a speed sensor)...
Figure 7.13 Reversal from a high speed with a load (without a speed sensor). (...
Chapter 8
Figure 8.1 Typical control structures for a grid‐connected inverter. (a) When ...
Figure 8.2 A compact controller that integrates synchronization and voltage/fr...
Figure 8.3 The per‐phase model of an SG connected to an infinite bus.
Figure 8.4 The controller for a self‐synchronized synchronverter.
Figure 8.5 Simulation results: under normal operation. (a) Frequencies
and
Figure 8.6 Simulation results: connection to the grid. (a)
and
. (b)
.
Figure 8.7 Comparison of the frequency responses of the self‐synchronized sync...
Figure 8.8 Dynamic performance when the grid frequency increased by 0.1 Hz at
Figure 8.9 Simulation results under grid faults: when the frequency dropped by...
Figure 8.10 Experimental results: when the grid frequency was lower (left colu...
Figure 8.11 Experimental results of the original synchronverter: when the grid...
Figure 8.12 Voltages around the connection time: when the grid frequency was l...
Chapter 9
Figure 9.1 Controlling the rectifier DC‐bus voltage without a dedicated synchr...
Figure 9.2 Controlling the rectifier power without a dedicated synchronization...
Figure 9.3 Simulation results when controlling the DC bus voltage. (a) Frequen...
Figure 9.4 Grid voltage and control signal. (a) Uncontrolled mode. (b) PWM‐con...
Figure 9.5 Grid voltage and input current. (a) Uncontrolled mode. (b) When
=0...
Figure 9.6 Simulation results when controlling the real power. (a) Frequencies...
Figure 9.7 Experiment results: controlling the DC‐bus voltage. (a) Frequencies...
Figure 9.8 Experiment results: controlling the power. (a) Grid and internal fr...
Chapter 10
Figure 10.1 Typical configuration of a turbine‐driven DFIG connected to the gr...
Figure 10.2 A model of an ancient Chinese south‐pointing chariot (WIKIpedia 20...
Figure 10.3 A differential gear that illustrates the mechanics of a DFIG, wher...
Figure 10.4 The electromechanical model of a DFIG connected to the grid.
Figure 10.5 Controller to operate the GSC as a GS‐VSM.
Figure 10.6 Controller to operate the RSC as a RS‐VSG.
Figure 10.7 Connection of the GS‐VSM to the grid.
Figure 10.8 Synchronization and connection of the RS‐VSG to the grid.
Figure 10.9 Operation of the DFIG‐VSG.
Figure 10.10 Experimental results of the DFIG‐VSG during synchronization proce...
Figure 10.11 Experimental results during the normal operation of the DFIG‐VSG.
Chapter 11
Figure 11.1 Three typical earthing networks in low‐voltage systems.
Figure 11.2 Generic equivalent circuit for analyzing leakage currents.
Figure 11.3 Equivalent circuit for analyzing leakage current of a grid‐tied co...
Figure 11.4 A conventional half‐bridge inverter. (a) Topology. (b) Average cir...
Figure 11.5 A transformerless PV inverter. (a) Topology. (b) Average circuit m...
Figure 11.6 Controller for the neutral leg.
Figure 11.7 Controller for the inverter leg.
Figure 11.8 Real‐time simulation results of the transformerless PV inverter in...
Chapter 12
Figure 12.1 STATCOM connected to a power system. (a) Sketch of the connection....
Figure 12.2 A typical two‐axis control strategy for a PWM based STATCOM using ...
Figure 12.3 A synchronverter based STATCOM controller.
Figure 12.4 Single‐line diagram of the power system used in the simulations.
Figure 12.5 Detailed model of the STATCOM used in the simulations.
Figure 12.6 Connecting the STATCOM to the grid. (a)
. (b)
. (c) Real power. ...
Figure 12.7 Simulation results of the STATCOM operated in different modes. (a)...
Figure 12.8 Transition from inductive to capacitive reactive power when the mo...
Figure 12.9 Simulation results of the STATCOM operated with a changing grid fr...
Figure 12.10 Simulation results of the STATCOM operated with a changing grid v...
Figure 12.11 Simulation results with a variable system strength. (a)
. (b)
....
Chapter 13
Figure 13.1 Per‐phase diagram with the Kron‐reduced network approach.
Figure 13.2 Phase portraits of the controller. (a) The frequency dynamics. (b)...
Figure 13.3 The controller to achieve bounded frequency and voltage.
Figure 13.4
surface (upper) and
surface (lower) with respect to
and
.
Figure 13.5 Illustration of the areas characterized by
lines and
lines.
Figure 13.6 Illustration of the area where a unique equilibrium exists. (a) Wh...
Figure 13.7 Real‐time simulation results comparing the original (SV) with the ...
Figure 13.8 Phase portraits of the controller states in real‐time simulations....
Chapter 14
Figure 14.1 The controller of the original synchronverter.
Figure 14.2 Active power regulation in a conventional synchronverter after dec...
Figure 14.3 Properties of the active power loop of a conventional synchronvert...
Figure 14.4 VSM with virtual inertia and virtual damping.
Figure 14.5 The small‐signal model of the active‐power loop with a virtual ine...
Figure 14.6 Implementations of a virtual damper. (a) Through impedance scaling...
Figure 14.7 A VSM in a microgrid connected to a stiff grid.
Figure 14.8 Normalized frequency response of a VSM with reconfigurable inertia...
Figure 14.9 Effect of the virtual damping (
s).
Figure 14.10 A microgrid with two VSMs.
Figure 14.11 Two VSMs operated in parallel with
s.
Figure 14.12 Two VSMs operated in parallel with
s and
s.
Figure 14.13 Simulation results under a ground fault with
s. (a) Normalized ...
Figure 14.14 Experimental results with reconfigurable inertia and damping. (a)...
Figure 14.15 Experimental results from the original synchronverter for compari...
Figure 14.16 Experimental results showing the effect of the virtual damping wi...
Figure 14.17 Experimental results when two VSMs with the same inertia time con...
Figure 14.18 Experimental results when two VSMs with the same inertia time con...
Figure 14.19 Experimental results when two VSMs with different inertia time co...
Figure 14.20 Experimental results when the two VSMs operated as the original S...
Chapter 15
Figure 15.1 Block diagrams of a conventional PLL. (a) Operational concept. (b)...
Figure 15.2 Enhanced phase‐locked loop (EPLL) or sinusoidal tracking algorithm...
Figure 15.3 Power delivery to a voltage source through an impedance.
Figure 15.4 Conventional droop control scheme for an inductive impedance. (a) ...
Figure 15.5 Conventional droop control strategies. (a) For resistive impedance...
Figure 15.6 Linking the droop controller in Figure 15.4(b) and the (inductive)...
Figure 15.7 Droop control strategies in the form of a phase‐locked loop. (a) W...
Figure 15.8 The conventional droop controller shown in Figure 15.4(a) after ad...
Figure 15.9 The synchronization capability of the droop controller shown in Fi...
Figure 15.10 Connection of the droop controlled inverter to the grid.
Figure 15.11 Regulation of the grid frequency and voltage in the droop mode.
Figure 15.12 Robustness of synchronization against DC‐bus voltage changes. (a)...
Figure 15.13 System response when the operation mode was changed.
Chapter 16
Figure 16.1 A single‐phase inverter. (a) Used for physical implementation. (...
Figure 16.2 Controller to achieve a resistive output impedance.
Figure 16.3 Controller to achieve a capacitive output impedance.
Figure 16.4 Typical output impedances of L‐, R‐, and C‐inverters.
Figure 16.5 Two R‐inverters operated in parallel.
Figure 16.6 Conventional droop control scheme for R‐inverters.
Figure 16.7 Experimental results: two R‐inverters in parallel with conventio...
Figure 16.8 Robust droop controller for R‐inverters.
Figure 16.9 Experimental results for the case with a linear load when invert...
Figure 16.10 Experimental results for the case with a linear load when inver...
Figure 16.11 Experimental results for the case with the same per‐unit impeda...
Figure 16.12 Experimental results with a nonlinear load: with the robust dro...
Figure 16.13 Robust droop controller for C‐inverters.
Figure 16.14 Experimental results of C‐inverters (left column) and R‐inverte...
Figure 16.15 Experimental results of C‐inverters (left column) and R‐inverte...
Figure 16.16 Robust droop controller for L‐inverters.
Figure 16.17 Experimental results of L‐inverters with a linear load: with th...
Figure 16.18 Experimental results of L‐inverters with a nonlinear load: with...
Chapter 17
Figure 17.1 The model of a single‐phase inverter.
Figure 17.2 The closed‐loop system consisting of the power flow model of an ...
Figure 17.3 Interpretation of transformation matrices
and
. (a)
. (b)
....
Figure 17.4 Interpretation of the universal transformation matrix
.
Figure 17.5 Universal droop controller.
Figure 17.6 Rel‐time simulation results of three inverters with different ty...
Figure 17.7 Experimental set‐up consisting of an L‐inverter, an R‐inverter, ...
Figure 17.8 Experimental results with the universal droop controller. (a)
...
Chapter 18
Figure 18.1 The self‐synchronized universal droop controller.
Figure 18.2 Experimental results of self‐synchronization with the R‐inverter...
Figure 18.3 Experimental results when connecting the R‐inverter to the grid....
Figure 18.4 Experimental results with the R‐inverter: performance during the...
Figure 18.5 Experimental results with the R‐inverter: regulation of system f...
Figure 18.6 Experimental results with the R‐inverter: change in the DC‐bus v...
Figure 18.7 Experimental results of self‐synchronization with the L‐inverter...
Figure 18.8 Experimental results with the L‐inverter: connection to the grid...
Figure 18.9 Experimental results with the L‐inverter: performance during the...
Figure 18.10 Experimental results with the L‐inverter: regulation of system ...
Figure 18.11 Experimental results with the L‐inverter: change in the DC‐bus ...
Figure 18.12 Experimental results of self‐synchronization with the L‐inverte...
Figure 18.13 Experimental results from the L‐inverter with the robust droop ...
Figure 18.14 Experimental results from the L‐inverter with the robust droop ...
Figure 18.15 Experimental results from the L‐inverter with the robust droop ...
Figure 18.16 Experimental results with the L‐inverter under robust droop con...
Figure 18.17 A microgrid including three inverters connected to a weak grid....
Figure 18.18 Real‐time simulation results from the microgrid. (a) Real power...
Chapter 19
Figure 19.1 A general three‐port converter with an AC port, a DC port, and a...
Figure 19.2 DC‐bus voltage controller to generate the real power reference....
Figure 19.3 The universal droop controller when the positive direction of th...
Figure 19.4 Finite state machine of the droop‐controlled rectifier.
Figure 19.5 Illustration of the operation of the droop‐controlled rectifier....
Figure 19.6 The
‐converter.
Figure 19.7 Control structure for the droop‐controlled rectifier. (a) Contro...
Figure 19.8 Experimental results in the GS mode. (a) Real power
, grid volt...
Figure 19.9 Experimental results in the NS‐H mode. (a) Real power
, grid vo...
Figure 19.10 Experimental results in the NS‐L mode. (a) Real power
, grid v...
Figure 19.11 Transient response when the system starts up. (a) Real power
,...
Figure 19.12 Transient response when a load is connected to the system. (a) ...
Figure 19.13 Experimental results showing the capacity potential of the rect...
Figure 19.14 Controller for the conversion leg.
Figure 19.15 Comparative experimental results with a conventional controller...
Chapter 20
Figure 20.1 A grid‐connected single‐phase inverter with an
filter.
Figure 20.2 The equivalent circuit diagram of the controller.
Figure 20.3 The overall control system.
Figure 20.4 Controller states. (a)
and
. (b)
and
.
Figure 20.5 Implementation of the current‐limiting universal droop controlle...
Figure 20.6 Operation with a normal grid. (a) Real and reactive power, RMS c...
Figure 20.7 Transient response of the controller states with a normal grid. ...
Figure 20.8 Operation under a grid voltage sag
for 9 s. (a) Real and react...
Figure 20.9 Controller states under the grid voltage sag
for 9 s. (a)
an...
Figure 20.10 Operation under a grid voltage sag
for 9 s. (a) Real and reac...
Figure 20.11 Controller states under the grid voltage sag
for 9 s. (a)
a...
Chapter 21
Figure 21.1 Two systems with disturbances interconnected through
.
Figure 21.2 Two systems with disturbances and external ports interconnected ...
Figure 21.3 Three‐phase grid‐connected converter with a local load.
Figure 21.4 The controller for a cybersync machine with
to be supplied as
Figure 21.5 The mathematical structure of the system constructed to facilita...
Figure 21.6 Blocks
and
implemented with the integral controller. (a)
. ...
Figure 21.7 A cybersync machine equipped with regulation and self‐synchroniz...
Figure 21.8 Simulation results from a cybersync machine, where the detailed ...
Figure 21.9 Experimental results from a cybersync machine. (a) Around synchr...
Chapter 22
Figure 22.1 A photo of the SYNDEM smart grid research and educational kit.
Figure 22.2 SYNDEM smart grid research and educational kit: main power circu...
Figure 22.3 Implementation of DC–DC converters. (a) Buck (step‐down) convert...
Figure 22.4 Implementation of uncontrolled rectifiers. (a) A single‐phase ha...
Figure 22.5 Implementation of PWM‐controlled rectifiers. (a) A single‐phase ...
Figure 22.6 Implementation of the
‐converter.
Figure 22.7 Implementation of inverters. (a) A single‐phase inverter. (b) A ...
Figure 22.8 Implementation of a DC–DC–AC converter.
Figure 22.9 Implementation of a single‐phase back‐to‐back converter.
Figure 22.10 Implementation of a three‐phase back‐to‐back converter.
Figure 22.11 Illustrative structure of the single‐node system.
Figure 22.12 Circuit of the single‐node system. (a) Wiring illustration with...
Figure 22.13 Experimental results from the single‐node system equipped with ...
Figure 22.14 Texas Tech SYNDEM microgrid built up with eight SYNDEM smart gr...
Chapter 23
Figure 23.1 Illinois Tech SYNDEM smart grid testbed. (a) System structure. (...
Figure 23.2 Topology of a
‐converter.
Figure 23.3 Topology of a Beijing converter.
Figure 23.5 Back‐to‐back converter formed by a
‐converter and a conversion ...
Figure 23.4 Back‐to‐back converter formed by a Beijing converter and a conve...
Figure 23.6 Operation of the energy bridge to black start the SYNDEM grid. (...
Figure 23.7 Integration of the solar power node. (a) Responses of the solar ...
Figure 23.8 Integration of the wind power node. (a) Responses of the wind po...
Figure 23.9 Performance of the wind power node when the wind speed
changes...
Figure 23.10 Integration of the DC‐load node. (a) Responses of the DC‐load V...
Figure 23.11 Integration of the AC‐load node. (a) Responses of the AC‐load V...
Figure 23.12 Operation of the whole testbed. (a) Responses of energy bridge ...
Chapter 24
Figure 24.1 The home field at the Texas Tech University Center at Junction, ...
Figure 24.2 The home grid. (a) One‐line diagram. (b) Its backbone: five Synd...
Figure 24.3 Black‐start and grid‐forming capabilities. (a) Whole process. (b...
Figure 24.4 From islanded to grid‐tied operation. (a) Whole process. (b) Zoo...
Figure 24.5 Seamless mode change when the public grid is lost and then recov...
Figure 24.6 Power sharing and regulation of the voltage and frequency of the...
Figure 24.7 The nonlinearity of the transformer. (a) With one inverter. (b) ...
Figure 24.8 The nonlinearity of household loads.
Figure 24.9 The large inrush current of the air‐conditioning unit.
Chapter 25
Figure 25.1 Panhandle wind power system. (a) Geographical illustration. (b) ...
Figure 25.2 Connection of a wind power generation system to the grid.
Figure 25.3 VSM controller for each wind turbine. (a) Robust droop control f...
Figure 25.4 Standard DQ controller for the GSC.
Figure 25.5 Simulated panhandle wind farms.
Figure 25.6 Simulation results from a single unit. (a) Dynamic response of t...
Figure 25.7 The voltage, frequency, active power, and reactive power at 345 ...
Figure 25.8 Panhandle wind power system: the voltage, frequency, active powe...
Guide
Cover
Table of Contents
Begin Reading
Pages
iii
iv
v
xix
xx
xxi
xxii
xxiii
xxiv
xxv
xxvi
xxvii
xxviii
xxix
xxx
xxxi
xxxiii
xxxiv
xxxv
xxxvi
xxxvii
xxxviii
xxxix
xl
xli
xlii
xliii
xliv
1
2
3
4
5
6
7
8
9
10
11
13
14
15
16
17
18
19
20
21
22
23
24
25
26
27
28
29
30
31
32
33
34
35
36
37
38
39
40
41
42
43
44
45
46
47
48
49
51
52
53
54
55
56
57
58
59
60
61
62
63
64
65
66
67
69
70
71
72
73
74
75
76
77
78
79
81
82
83
84
85
86
87
88
89
90
91
92
93
94
95
96
97
98
99
100
101
102
103
104
105
106
107
108
109
110
111
112
113
114
115
116
117
118
119
120
121
122
123
124
125
126
127
128
129
130
131
132
133
134
135
136
137
138
139
140
141
142
143
144
145
146
147
148
149
150
151
152
153
155
156
157
158
159
160
161
162
163
164
165
166
167
169
170
171
172
173
174
175
176
177
178
179
180
181
182
183
184
185
187
188
189
190
191
192
193
194
195
196
197
198
199
200
201
202
203
204
205
206
207
208
209
210
211
212
213
214
215
216
217
218
219
220
221
222
223
224
225
226
227
229
230
231
232
233
234
235
236
237
238
239
240
241
242
243
245
246
247
248
249
250
251
252
253
254
255
256
257
258
259
260
261
262
263
264
265
266
267
268
269
270
271
272
273
274
275
276
277
278
279
280
281
283
284
285
286
287
288
289
290
291
292
293
294
295
296
297
298
299
300
301
302
303
304
305
306
307
308
309
310
311
312
313
314
315
316
317
318
319
320
321
322
323
324
325
326
327
328
329
330
331
332
333
334
335
336
337
338
339
341
342
343
344
345
346
347
348
349
350
351
352
353
354
355
356
357
358
359
360
361
362
363
364
365
367
368
369
370
371
372
373
374
375
376
377
378
379
380
381
382
383
384
385
386
387
388
389
390
391
392
393
395
396
397
398
399
400
401
402
403
404
405
406
407
408
409
410
411
412
413
414
415
416
417
418
419
420
421
422
423
424
425
426
427
428
429
430
431
432
433
434
435
436
437
438
439
441
442
443
444
445
446
447
448
Power Electronics-Enabled Autonomous Power Systems
Next Generation Smart Grids
Qing-Chang ZhongIllinois Institute of Technology & Syndem LLCChicago, USA
This edition first published 2020© 2020 John Wiley & Sons Ltd
All rights reserved. No part of this publication may be reproduced, stored in a retrieval system, or transmitted, in any form or by any means, electronic, mechanical, photocopying, recording or otherwise, except as permitted by law. Advice on how to obtain permission to reuse material from this title is available at http://www.wiley.com/go/permissions.
The right of Qing‐Chang Zhong to be identified as the author of this work has been asserted in accordance with law.
Registered OfficesJohn Wiley & Sons, Inc., 111 River Street, Hoboken, NJ 07030, USAJohn Wiley & Sons Ltd, The Atrium, Southern Gate, Chichester, West Sussex, PO19 8SQ, UK
Editorial OfficeThe Atrium, Southern Gate, Chichester, West Sussex, PO19 8SQ, UK
For details of our global editorial offices, customer services, and more information about Wiley products visit us at www.wiley.com.
Wiley also publishes its books in a variety of electronic formats and by print‐on‐demand. Some content that appears in standard print versions of this book may not be available in other formats.
Limit of Liability/Disclaimer of WarrantyMATLAB® is a trademark of The MathWorks, Inc. and is used with permission. The MathWorks does not warrant the accuracy of the text or exercises in this book. This work's use or discussion of MATLAB® software or related products does not constitute endorsement or sponsorship by The MathWorks of a particular pedagogical approach or particular use of the MATLAB® software. In view of ongoing research, equipment modifications, changes in governmental regulations, and the constant flow of information relating to the use of experimental reagents, equipment, and devices, the reader is urged to review and evaluate the information provided in the package insert or instructions for each chemical, piece of equipment, reagent, or device for, among other things, any changes in the instructions or indication of usage and for added warnings and precautions. While the publisher and author have used their best efforts in preparing this work, they make no representations or warranties with respect to the accuracy or completeness of the contents of this work and specifically disclaim all warranties, including without limitation any implied warranties of merchantability or fitness for a particular purpose. No warranty may be created or extended by sales representatives, written sales materials or promotional statements for this work. The fact that an organization, website, or product is referred to in this work as a citation and/or potential source of further information does not mean that the publisher and author endorse the information or services the organization, website, or product may provide or recommendations it may make. This work is sold with the understanding that the publisher is not engaged in rendering professional services. The advice and strategies contained herein may not be suitable for your situation. You should consult with a specialist where appropriate. Further, readers should be aware that websites listed in this work may have changed or disappeared between when this work was written and when it is read. Neither the publisher nor author shall be liable for any loss of profit or any other commercial damages, including but not limited to special, incidental, consequential, or other damages.
Library of Congress Cataloging‐in‐Publication data applied for
HB ISBN: 9781118803523
Cover Design: Wiley
Cover Images: Electric Car © Nerthuz/Getty Images, Computer Technology © RoyFWylam/Getty Images, Led light bulb © ppart/Shutterstock, Industrial electric motor © scanrail/Getty Images, Hydro dam water © ChrisGorgio/Getty Images, Solar Panel © filo/Getty Images, Energy © Voyagerix/Shutterstock, Nuclear power plant © TTstudio/Shutterstock, A field of wind turbines © linearcurves/Getty Images
To
Ms. Lihua Luo, my first‐grade teacher, who told me:
“you have nothing but potential. Keep moving forward. Never stop.”
and
Ms. Xiufen Lin, my third‐grade teacher, who told me:
“you have nothing but do not envy others.”
List of Tables
Table 1.1 Comparison of today's grid, smart grid, and next‐generation smart grid 9
Table 2.1 Machines that power the industrial revolutions.
Table 3.1 The electrical‐mechanical analogy based on the force–current analogy.
Table 4.1 Parameters of the synchronverter for simulations.
Table 4.2 Parameters of VSG.
Table 4.3 Parameters of VSG2.
Table 5.1 Parameters of the rectifier under simulation.
Table 6.1 Parameters of a PMSG wind turbine system.
Table 6.2 GSC control parameters.
Table 6.3 RSC control parameters.
Table 7.1 Comparison of different control strategies for AC VSDs.
Table 7.2 Parameters of the motor.
Table 8.1 Operation modes of a self‐synchronised synchronverter.
Table 8.2 Parameters used in simulations and experiments.
Table 8.3 Impact on the complexity of the overall controller and the demand for the computational capability.
Table 9.1 Parameters of the rectifier.
Table 9.2 Parameters for controlling the DC‐bus voltage.
Table 9.3 Parameters for controlling the the power.
Table 10.1 Comparison of different wind power generation systems.
Table 10.2 DFIG‐VSG parameters.
Table 10.3 Parameters of the experimental DFIG system.
Table 11.1 Operation modes of the PV inverter.
Table 11.2 Parameters of the system.
Table 12.1 Operation modes of a STATCOM.
Table 13.1 Parameters of a synchronverter.
Table 14.1 Parameters of the system under simulation.
Table 15.1 Operation modes.
Table 15.2 Parameters of the inverter.
Table 17.1 Droop controllers for L‐, R‐, C‐, RL‐, and RC‐inverters.
Table 17.2 Steady‐state performance of the three inverters in parallel operation.
Table 18.1 Operation modes of the self‐synchronized universal droop controller.
Table 18.2 Parameters of the inverter.
Table 18.3 Parameters of the microgrid.
Table 19.1 Parameters of the experimental droop‐controlled rectifier.


