98,99 €
Mehr erfahren.
- Herausgeber: John Wiley & Sons
- Kategorie: Wissenschaft und neue Technologien
- Serie: Wiley Series in Probability and Statistics
- Sprache: Englisch
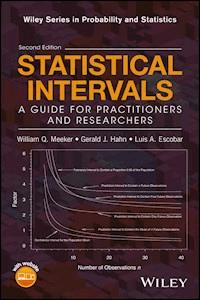
Describes statistical intervals to quantify sampling uncertainty,focusing on key application needs and recently developed methodology in an easy-to-apply format
Statistical intervals provide invaluable tools for quantifying sampling uncertainty. The widely hailed first edition, published in 1991, described the use and construction of the most important statistical intervals. Particular emphasis was given to intervals—such as prediction intervals, tolerance intervals and confidence intervals on distribution quantiles—frequently needed in practice, but often neglected in introductory courses.
Vastly improved computer capabilities over the past 25 years have resulted in an explosion of the tools readily available to analysts. This second edition—more than double the size of the first—adds these new methods in an easy-to-apply format. In addition to extensive updating of the original chapters, the second edition includes new chapters on:
- Likelihood-based statistical intervals
- Nonparametric bootstrap intervals
- Parametric bootstrap and other simulation-based intervals
- An introduction to Bayesian intervals
- Bayesian intervals for the popular binomial, Poisson and normal distributions
- Statistical intervals for Bayesian hierarchical models
- Advanced case studies, further illustrating the use of the newly described methods
New technical appendices provide justification of the methods and pathways to extensions and further applications. A webpage directs readers to current readily accessible computer software and other useful information.
Statistical Intervals: A Guide for Practitioners and Researchers, Second Edition is an up-to-date working guide and reference for all who analyze data, allowing them to quantify the uncertainty in their results using statistical intervals.
Das E-Book können Sie in Legimi-Apps oder einer beliebigen App lesen, die das folgende Format unterstützen:
Seitenzahl: 1299
Veröffentlichungsjahr: 2017
Ähnliche


WILEY SERIES IN PROBABILITY AND STATISTICS
The Wiley Series in Probability and Statistics is well established and authoritative. It covers many topics of current research interest in both pure and applied statistics and probability theory. Written by leading statisticians and institutions, the titles span both state-of-the-art developments in the field and classical methods.
Reflecting the wide range of current research in statistics, the series encompasses applied, methodological and theoretical statistics, ranging from applications and new techniques made possible by advances in computerized practice to rigorous treatment of theoretical approaches.
This series provides essential and invaluable reading for all statisticians, whether in academia, industry, government, or research.
A complete list of titles in this series appears at the end of the volume.
Statistical Intervals
A Guide for Practitioners and Researchers
Second Edition
William Q. Meeker
Department of Statistics, Iowa State University
Gerald J. Hahn
General Electric Company, Global Research Center (Retired) Schenectady, NY
Luis A. Escobar
Department of Experimental Statistics, Louisiana State University
Copyright © 2017 by John Wiley & Sons, Inc. All rights reserved.
Published by John Wiley & Sons, Inc., Hoboken, New Jersey. Published simultaneously in Canada.
No part of this publication may be reproduced, stored in a retrieval system, or transmitted in any form or by any means, electronic, mechanical, photocopying, recording, scanning, or otherwise, except as permitted under Section 107 or 108 of the 1976 United States Copyright Act, without either the prior written permission of the Publisher, or authorization through payment of the appropriate per-copy fee to the Copyright Clearance Center, Inc., 222 Rosewood Drive, Danvers, MA 01923, (978) 750-8400, fax (978) 750-4470, or on the web at www.copyright.com. Requests to the Publisher for permission should be addressed to the Permissions Department, John Wiley & Sons, Inc., 111 River Street, Hoboken, NJ 07030, (201) 748-6011, fax (201) 748-6008, or online at http://www.wiley.com/go/permission.
Limit of Liability/Disclaimer of Warranty: While the publisher and author have used their best efforts in preparing this book, they make no representations or warranties with respect to the accuracy or completeness of the contents of this book and specifically disclaim any implied warranties of merchantability or fitness for a particular purpose. No warranty may be created or extended by sales representatives or written sales materials. The advice and strategies contained herein may not be suitable for your situation. You should consult with a professional where appropriate. Neither the publisher nor author shall be liable for any loss of profit or any other commercial damages, including but not limited to special, incidental, consequential, or other damages.
For general information on our other products and services or for technical support, please contact our Customer Care Department within the United States at (800) 762-2974, outside the United States at (317) 572-3993 or fax (317) 572-4002.
Wiley also publishes its books in a variety of electronic formats. Some content that appears in print may not be available in electronic formats. For more information about Wiley products, visit our web site at www.wiley.com.
Library of Congress Cataloging-in-Publication Data:
Names: Meeker, William Q. | Hahn, Gerald J. | Escobar, Luis A.
Title: Statistical intervals : a guide for practitioners and researchers.
Description: Second edition / William Q. Meeker, Gerald J. Hahn, Luis A.
Escobar. | Hoboken, New Jersey : John Wiley & Sons, Inc., [2017] |
Includes bibliographical references and index.
Identifiers: LCCN 2016053941 | ISBN 9780471687177 (cloth) | ISBN 9781118595169 (epub)
Subjects: LCSH: Mathematical statistics.
Classification: LCC QA276 .H22 2017 | DDC 519.5/4–dc23 LC record available
at https://lccn.loc.gov/2016053941
To Karen, Katherine, Josh, Liam, Ayla, and my parents
W. Q. M.
To Bea, Adrienne and Lou, Susan and John, Judy and Ben, and Zachary, Eli, Sam, Leah and Eliza
G. J. H.
To my grandchildren: Olivia, Lillian, Nathaniel, Gabriel, Samuel, Emmett, and Jackson
L. A. E.
CONTENTS
Preface to Second Edition
Preface to First Edition
Acknowledgments
About the Companion Website
Chapter 1: Introduction, Basic Concepts, and Assumptions
Objectives and Overview
1.1 Statistical Inference
1.2 Different Types of Statistical Intervals: An Overview
1.3 The Assumption of Sample Data
1.4 The Central Role of Practical Assumptions Concerning Representative Data
1.5 Enumerative Versus Analytic Studies
1.6 Basic Assumptions for Inferences from Enumerative Studies
1.7 Considerations in the Conduct of Analytic Studies
1.8 Convenience and Judgment Samples
1.9 Sampling People
1.10 Infinite Population Assumption
1.11 Practical Assumptions: Overview
1.12 Practical Assumptions: Further Example
1.13 Planning the Study
1.14 The Role of Statistical Distributions
1.15 The Interpretation of Statistical Intervals
1.16 Statistical Intervals and Big Data
1.17 Comment Concerning Subsequent Discussion
Bibliographic Notes
Chapter 2: Overview of Different Types of Statistical Intervals
Objectives and Overview
2.1 Choice of a Statistical Interval
2.2 Confidence Intervals
2.3 Prediction Intervals
2.4 Statistical Tolerance Intervals
2.5 Which Statistical Interval do I Use?
2.6 Choosing a Confidence Level
2.7 Two-Sided Statistical Intervals Versus One-Sided Statistical Bounds
2.8 The Advantage of Using Confidence Intervals Instead of Significance Tests
2.9 Simultaneous Statistical Intervals
Bibliographic Notes
Chapter 3: Constructing Statistical Intervals Assuming a Normal Distribution Using Simple Tabulations
Objectives and Overview
3.1 Introduction
3.2 Circuit Pack Voltage Output Example
3.3 Two-Sided Statistical Intervals
3.4 One-Sided Statistical Bounds
Chapter 4: Methods for Calculating Statistical Intervals for a Normal Distribution
Objectives and Overview
4.1 Notation
4.2 Confidence Interval for the Mean of A Normal Distribution
4.3 Confidence Interval for The Standard Deviation of a Normal Distribution
4.4 Confidence Interval for a Normal Distribution Quantile
4.5 Confidence Interval for the Distribution Proportion Less (Greater) than a Specified Value
4.6 Statistical Tolerance Intervals
4.7 Prediction Interval to Contain a Single Future Observation or the Mean of
m
Future Observations
4.8 Prediction Interval to Contain at Least
k
of
m
Future Observations
4.9 Prediction Interval to Contain the Standard Deviation of
m
Future Observations
4.10 The Assumption of a Normal Distribution
4.11 Assessing Distribution Normality and Dealing with Nonnormality
4.12 Data Transformations and Inferences from Transformed Data
4.13 Statistical Intervals for Linear Regression Analysis
4.14 Statistical Intervals for Comparing Populations and Processes
Bibliographic Notes
Chapter 5: Distribution-Free Statistical Intervals
Objectives and Overview
5.1 Introduction
5.2 Distribution-Free Confidence Intervals and One-Sided Confidence Bounds for a Quantile
5.3 Distribution-Free Tolerance Intervals and Bounds to Contain a Specified Proportion of a Distribution
5.4 Prediction Intervals and Bounds to Contain a Specified Ordered Observation in a Future Sample
5.5 Distribution-Free Prediction Intervals and Bounds to Contain at Least
k
of
m
Future Observations
Bibliographic Notes
Chapter 6: Statistical Intervals for a Binomial Distribution
Objectives and Overview
6.1 Introduction
6.2 Confidence Intervals for the Actual Proportion Nonconforming in the Sampled Distribution
6.3 Confidence Interval for the Proportion of Nonconforming Units in a Finite Population
6.4 Confidence Intervals for the Probability that The Number of Nonconforming Units in a Sample is Less than or Equal to (or Greater Than) a Specified Number
6.5 Confidence Intervals for the Quantile of the Distribution of the Number of Nonconforming Units
6.6 Tolerance Intervals and One-Sided Tolerance Bounds for the Distribution of the Number of Nonconforming Units
6.7 Prediction Intervals for the Number Nonconforming in a Future Sample
Bibliographic Notes
Chapter 7: Statistical Intervals for a Poisson Distribution
Objectives and Overview
7.1 Introduction
7.2 Confidence Intervals for the Event-Occurrence Rate of a Poisson Distribution
7.3 Confidence Intervals for the Probability that the Number of Events in a Specified Amount of Exposure is Less than or Equal to (or Greater Than) A Specified Number
7.4 Confidence Intervals for the Quantile of the Distribution of the Number of Events in a Specified Amount of Exposure
7.5 Tolerance Intervals and One-Sided Tolerance Bounds for the Distribution of the Number of Events in a Specified Amount of Exposure
7.6 Prediction Intervals for the Number of Events in a Future Amount of Exposure
Bibliographic Notes
Chapter 8: Sample Size Requirements for Confidence Intervals on Distribution Parameters
Objectives and Overview
8.1 Basic Requirements for Sample Size Determination
8.2 Sample Size for a Confidence Interval for a Normal Distribution Mean
8.3 Sample Size to Estimate a Normal Distribution Standard Deviation
8.4 Sample Size to Estimate a Normal Distribution Quantile
8.5 Sample Size to Estimate a Binomial Proportion
8.6 Sample Size to Estimate a Poisson Occurrence Rate
Bibliographic Notes
Chapter 9: Sample Size Requirements for Tolerance Intervals, Tolerance Bounds, and Related Demonstration Tests
Objectives and Overview
9.1 Sample Size for Normal Distribution Tolerance Intervals and One-Sided Tolerance Bounds
9.2 Sample Size to Pass a One-Sided Demonstration Test Based on Normally Distributed Measurements
9.3 Minimum Sample Size for Distribution-Free Two-Sided Tolerance Intervals and One-Sided Tolerance Bounds
9.4 Sample Size for Controlling The Precision of Two-Sided Distribution-Free Tolerance Intervals and One-Sided Distribution-Free Tolerance Bounds
9.5 Sample Size to Demonstrate that a Binomial Proportion Exceeds (Is Exceeded By) a Specified Value
Bibliographic Notes
Chapter 10: Sample Size Requirements for Prediction Intervals
Objectives and Overview
10.1 Prediction Interval Width: The Basic Idea
10.2 Sample Size for a Normal Distribution Prediction Interval
10.3 Sample Size for Distribution-Free Prediction Intervals for at least
k
of
m
Future Observations
Bibliographic Notes
Chapter 11: Basic Case Studies
Objectives and Overview
11.1 Demonstration That the Operating Temperature of Most Manufactured Devices will not Exceed a Specified Value
11.2 Forecasting Future Demand for Spare Parts
11.3 Estimating the Probability of Passing an Environmental Emissions Test
11.4 Planning A Demonstration Test to Verify that a Radar System has a Satisfactory Probability of Detection
11.5 Estimating the Probability of Exceeding a Regulatory Limit
11.6 Estimating the Reliability of a Circuit Board
11.7 Using Sample Results to Estimate the Probability that a Demonstration Test will be Successful
11.8 Estimating the Proportion within Specifications for a Two-Variable Problem
11.9 Determining the Minimum Sample Size for a Demonstration Test
Chapter 12: Likelihood-Based Statistical Intervals
Objectives and Overview
12.1 Introduction to Likelihood-Based Inference
12.2 Likelihood Function and Maximum Likelihood Estimation
12.3 Likelihood-Based Confidence Intervals for Single-Parameter Distributions
12.4 Likelihood-Based Estimation Methods for Location-Scale and Log-Location-Scale Distributions
12.5 Likelihood-Based Confidence Intervals for Parameters and Scalar Functions of Parameters
12.6 Wald-Approximation Confidence Intervals
12.7 Some Other Likelihood-Based Statistical Intervals
Bibliographic Notes
Chapter 13: Nonparametric Bootstrap Statistical Intervals
Objectives and Overview
13.1 Introduction
13.2 Nonparametric Methods for Generating Bootstrap Samples and Obtaining Bootstrap Estimates
13.3 Bootstrap Operational Considerations
13.4 Nonparametric Bootstrap Confidence Interval Methods
Bibliographic Notes
Chapter 14: Parametric Bootstrap and Other Simulation-Based Statistical Intervals
Objectives and Overview
14.1 Introduction
14.2 Parametric Bootstrap Samples and Bootstrap Estimates
14.3 Bootstrap Confidence Intervals Based on Pivotal Quantities
14.4 Generalized Pivotal Quantities
14.5 Simulation-Based Tolerance Intervals for Location-Scale or Log-Location-Scale Distributions
14.6 Simulation-Based Prediction Intervals and One-Sided Prediction Bounds for at least
k
of
m
Future Observations from Location-Scale or Log-Location-Scale Distributions
14.7 Other Simulation and Bootstrap Methods and Application to Other Distributions and Models
Bibliographic Notes
Chapter 15: Introduction to Bayesian Statistical Intervals
Objectives and Overview
15.1 Bayesian Inference: Overview
15.2 Bayesian Inference: An Illustrative Example
15.3 More About Specification of A Prior Distribution
15.4 Implementing Bayesian Analyses using Markov Chain Monte Carlo Simulation
15.5 Bayesian Tolerance and Prediction Intervals
Bibliographic Notes
Chapter 16: Bayesian Statistical Intervals for the Binomial, Poisson, and Normal Distributions
Objectives and Overview
16.1 Bayesian Intervals for the Binomial Distribution
16.2 Bayesian Intervals for the Poisson Distribution
16.3 Bayesian Intervals for the Normal Distribution
Bibliographic Notes
Chapter 17: Statistical Intervals for Bayesian Hierarchical Models
Objectives and Overview
17.1 Bayesian Hierarchical Models and Random Effects
17.2 Normal Distribution Hierarchical Models
17.3 Binomial Distribution Hierarchical Models
17.4 Poisson Distribution Hierarchical Models
17.5 Longitudinal Repeated Measures Models
Bibliographic Notes
Chapter 18: Advanced Case Studies
Objectives and Overview
18.1 Confidence Interval for the Proportion of Defective Integrated Circuits
18.2 Confidence Intervals for Components of Variance in a Measurement Process
18.3 Tolerance Interval to Characterize the Distribution of Process Output in the Presence of Measurement Error
18.4 Confidence Interval for the Proportion of Product Conforming to a Two-Sided Specification
18.5 Confidence Interval for the Treatment Effect in a Marketing Campaign
18.6 Confidence Interval for the Probability of Detection with Limited Hit/Miss Data
18.7 Using Prior Information to Estimate the Service-Life Distribution of a Rocket Motor
Bibliographic Notes
Epilogue
Appendix A: Notation and Acronyms
Appendix B: Generic Definition of Statistical Intervals and Formulas for Computing Coverage Probabilities
B.1 Introduction
B.2 Two-Sided Confidence Intervals and One-Sided Confidence Bounds for Distribution Parameters or a Function of Parameters
B.3 Two-Sided Control-the-Center Tolerance Intervals to Contain at Least a Specified Proportion of a Distribution
B.4 Two-Sided Tolerance Intervals to Control Both Tails of a Distribution
B.5 One-Sided Tolerance Bounds
B.6 Two-Sided Prediction Intervals and One-Sided Prediction Bounds for Future Observations
B.7 Two-Sided Simultaneous Prediction Intervals and One-Sided Simultaneous Prediction Bounds
B.8 Calibration of Statistical Intervals
Appendix C: Useful Probability Distributions
Introduction
C.1 Probability Distributions and
R
Computations
C.2 Important Characteristics of Random Variables
C.3 Continuous Distributions
C.4 Discrete Distributions
Appendix D: General Results from Statistical Theory and Some Methods Used to Construct Statistical Intervals
Introduction
D.1 The Cdfs and Pdfs of Functions of Random Variables
D.2 Statistical Error Propagation—The Delta Method
D.3 Likelihood and Fisher Information Matrices
D.4 Convergence in Distribution
D.5 Outline of General Maximum Likelihood Theory
D.6 The Cdf Pivotal Method for Obtaining Confidence Intervals
D.7 Bonferroni Approximate Statistical Intervals
Appendix E: Pivotal Methods for Constructing Parametric Statistical Intervals
Introduction
E.1 General Definition and Examples of Pivotal Quantities
E.2 Pivotal Quantities for the Normal Distribution
E.3 Confidence Intervals for a Normal Distribution Based on Pivotal Quantities
E.4 Confidence Intervals for two Normal Distributions Based on Pivotal Quantities
E.5 Tolerance Intervals for a Normal Distribution Based on Pivotal Quantities
E.6 Normal Distribution Prediction Intervals Based on Pivotal Quantities
E.7 Pivotal Quantities for Log-Location-Scale Distributions
Appendix F: Generalized Pivotal Quantities
Introduction
F.1 Definition of a Generalized Pivotal Quantity
F.2 A Substitution Method to Obtain Generalized Pivotal Quantities
F.3 Examples of Generalized Pivotal Quantities for Functions of Location-Scale Distribution Parameters
F.4 Conditions for Exact Confidence Intervals Derived from Generalized Pivotal Quantities
Appendix G: Distribution-Free Intervals Based on Order Statistics
Introduction
G.1 Basic Statistical Results Used in this Appendix
G.2 Distribution-Free Confidence Intervals and Bounds for a Distribution Quantile
G.3 Distribution-Free Tolerance Intervals to Contain a Given Proportion of a Distribution
G.4 Distribution-Free Prediction Interval to Contain a Specified Ordered Observation from a Future Sample
G.5 Distribution-Free Prediction Intervals and Bounds to Contain at Least
k
of
m
Future Observations from a Future Sample
Appendix H: Basic Results from Bayesian Inference Models
Introduction
H.1 Basic Results Used in this Appendix
H.2 Bayes’ Theorem
H.3 Conjugate Prior Distributions
H.4 Jeffreys Prior Distributions
H.5 Posterior Predictive Distributions
H.6 Posterior Predictive Distributions Based on Jeffreys Prior Distributions
Appendix I: Probability of Successful Demonstration
I.1 Demonstration Tests Based on a Normal Distribution Assumption
I.2 Distribution-Free Demonstration Tests
Appendix J: Tables
References
Index
Wiley Series in Probability and Statistics
EULA
List of Tables
Chapter 2
Table 2.1
Chapter 4
Table 4.1
Table 4.2
Chapter 5
Table 5.1
Chapter 6
Table 6.1
Table 6.2
Chapter 7
Table 7.1
Chapter 11
Table 11.1
Table 11.2
Table 11.3
Table 11.4
Table 11.5
Table 11.6
Chapter 12
Table 12.1
Table 12.2
Table 12.3
Table 12.4
Table 12.5
Table 12.6
Chapter 13
Table 13.1
Table 13.2
Table 13.3
Table 13.4
Table 13.5
Chapter 14
Table 14.1
Table 14.2
Table 14.3
Table 14.4
Table 14.5
Table 14.6
Table 14.7
Table 14.8
Chapter 15
Table 15.1
Table 15.2
Table 15.3
Table 15.4
Chapter 16
Table 16.1
Table 16.2
Table 16.3
Table 16.4
Chapter 17
Table 17.1
Table 17.2
Table 17.3
Chapter 18
Table 18.1
Table 18.2
Table 18.3
Table 18.4
Table 18.5
Table 18.6
Table 18.7
Table 18.8
Table 18.9
Table 18.10
Table 18.11
Appendix C
Table C.1
Table C.2
Appendix J
Table J.1a
Table J.1b
Table J.2a
Table J.2b
Table J.3a
Table J.3b
Table J.4a
Table J.4b
Table J.5a
Table J.5b
Table J.6a
Table J.6b
Table J.7a
Table J.7b
Table J.7c
Table J.7d
Table J.8
Table J.9
Table J.10a
Table J.10b
Table J.10c
Table J.11
Table J.12
Table J.13
Table J.14a
Table J.14b
Table J.14c
Table J.15
Table J.16a
Table J.16b
Table J.16c
Table J.17a
Table J.17b
Table J.18
Table J.19
Table J.20
Table J.21
Guide
Cover
Table of Contents
Preface
Pages
xxv
xxvi
xxvii
xxviii
xxix
xxx
xxxi
xxxii
xxxiii
xxxiv
xxxv
1
2
3
4
5
6
7
8
9
10
11
12
13
14
15
16
17
18
19
20
21
22
23
24
25
26
27
28
29
30
31
32
33
34
35
36
37
38
39
40
41
42
43
44
45
47
48
49
50
51
52
53
54
55
56
57
58
59
60
61
62
63
64
65
66
67
68
69
70
71
73
74
75
76
77
78
79
80
81
82
83
84
85
86
87
88
89
90
91
92
93
94
95
96
97
98
99
100
101
102
103
104
105
106
107
108
111
112
113
114
115
116
117
118
119
120
121
122
123
124
125
126
127
128
129
130
131
132
133
134
135
136
137
138
139
140
141
142
143
144
145
146
147
149
150
151
152
153
154
155
156
157
158
159
161
163
164
165
166
169
170
171
172
175
177
178
179
180
181
182
183
184
185
186
187
188
189
190
191
192
193
194
195
196
197
198
199
200
201
202
203
204
205
206
207
208
209
210
211
213
214
215
216
217
218
219
220
221
222
223
224
225
226
227
228
229
230
231
232
233
234
235
236
237
238
239
240
241
242
243
244
245
246
247
248
249
250
251
252
253
254
255
256
257
258
259
260
261
262
263
264
265
266
267
268
269
270
271
272
273
274
275
276
277
278
279
280
281
282
283
284
285
286
287
288
289
290
291
292
293
294
295
296
297
298
299
300
301
302
303
304
305
306
307
308
309
310
311
312
313
314
315
316
317
318
319
320
321
322
323
325
326
327
328
329
330
331
332
333
334
335
336
337
338
339
340
341
342
343
344
345
346
347
348
349
350
351
352
353
354
355
356
357
358
359
360
361
362
363
364
365
367
368
369
370
371
372
373
374
375
376
377
378
379
380
381
382
383
384
385
386
387
388
389
390
391
392
393
395
403
404
405
406
407
408
409
410
411
412
413
414
415
416
417
418
419
420
421
423
424
425
426
427
428
429
430
431
432
433
434
435
436
437
438
439
440
441
442
443
444
445
447
448
449
450
451
452
453
454
455
456
457
458
459
460
461
462
463
464
465
466
467
468
469
470
471
473
474
475
476
477
478
479
480
481
482
483
484
485
486
487
489
490
491
492
493
494
495
497
498
499
500
501
502
503
504
505
506
507
509
510
511
512
513
514
515
516
517
518
519
520
521
522
523
524
525
526
527
528
529
530
531
532
533
534
535
536
537
538
539
540
541
542
543
544
545
546
547
548
549
550
551
552
553
554
555
556
557
558
559
560
561
562
563
564
565
566
567
568
569
570
571
572
573
574
575
576
577
578
579
580
581
582
583
584
585
586
587
588
589
590
591
592
593
594
595
596
597
598
599
600
601
602
603
604
605
606
607
608
609
610
611
612
Preface to Second Edition
Overview
The first edition of Statistical Intervals was published twenty-five years ago. We believe the book successfully met its goal of providing a comprehensive overview of statistical intervals for practitioners and statisticians and we have received much positive feedback. Despite, and perhaps because of this, there were compelling reasons for a second edition. In developing this second edition, Bill Meeker and Gerry Hahn have been most fortunate to have a highly qualified colleague, Luis Escobar, join them.
The new edition aims to:
Improve or expand on various previously presented statistical intervals, using methods developed since the first edition was published.
Provide general methods for constructing statistical intervals—some of which have recently been developed or refined—for important situations beyond those previously considered.
Provide a webpage that gives up-to-date information about available software for calculating statistical intervals, as well as other important up-to-date information.
Provide, via technical appendices, some of the theory underlying the intervals presented in this book.
In addition to updating the original chapters, this new edition includes new chapters on
Likelihood-based statistical intervals (
Chapter 12
).
Nonparametric bootstrap statistical intervals (
Chapter 13
).
Parametric bootstrap and other simulation-based statistical intervals (
Chapter 14
).
An introduction to Bayesian statistical intervals (
Chapter 15
).
Bayesian statistical intervals for the binomial, Poisson, and normal distributions (
Chapter 16
).
Statistical intervals for Bayesian hierarchical models (
Chapter 17
).
The new edition also includes an additional chapter on advanced case studies (Chapter 18). This chapter further illustrates the use of the newly introduced more advanced general methods for constructing statistical intervals. In totality, well over half of this second edition is new material—an indication of how much has changed over the past twenty-five years.
The first edition tended to focus on simple methods for constructing statistical intervals in commonly encountered situations and relied heavily on tabulations, charts, and simple formulas. The new edition adds methodology that can be readily implemented using easy-to-access software and allows more complicated problems to be addressed.
The purpose and audience for the book, however, remain essentially the same and what we said in the preface to the first edition (see below) still holds. We expect the book to continue to appeal to practitioners and statisticians who need to apply statistical intervals and hope that this appeal will be enhanced by the addition of the new and updated material. In addition, we expect the new edition to have added attraction to those interested in the theory underlying the construction of statistical intervals. With this in mind, we have extended the book title to read Statistical Intervals: A Guide for Practitioners and Researchers.
We have added many new applications to illustrate the use of the methods that we present. As in the first edition, all of these applications are based on real data. In some of these, however, we have changed the names of the variables or the scale of the data to protect sensitive information.
Elaboration on New Methods
Chapters 3 and 4 continue to describe (and update) familiar classical statistical methods for confidence intervals, tolerance intervals, and prediction intervals for situations in which one has a simple random sample from an underlying population or process that can be adequately described by a normal distribution. The interval procedures in these chapters have the desirable property of being “exact”—their coverage probabilities (i.e., the probability that the interval constructed using the procedure will include the quantity it was designed to include) are equal to their nominal confidence levels.
For distributions other than the normal, however, we must often resort to the use of approximate procedures for setting statistical intervals. Such procedures have coverage probabilities that usually differ from their (desired or specified) nominal confidence levels. Seven new chapters (Chapters 12–18) describe and illustrate the use of procedures for constructing intervals that are usually approximate. These procedures also have applicability for constructing statistical intervals in more complicated situations involving, for example, nonlinear regression models, random-effects models, and censored, truncated, or correlated data, building on the significant recent research in these areas. At the time of the first edition, such advanced methods were not widely used because they were not well known, and tended to be computationally intensive for the then available computing capabilities. Also, their statistical properties had not been studied carefully. Therefore, we provided only a brief overview of such methods in Chapter 12 of the first edition. Today, such methods are considered state of the art and readily achievable computationally. The new methods generally provide coverage probabilities that are closer to the nominal confidence level than the computationally simple Wald-approximation (also known as normal-approximate) methods that are still commonly used today to calculate statistical intervals in some popular statistical computing packages.
Other major changes in the new edition include updates to Chapters 5–7:
Chapter 5
(on distribution-free statistical intervals) includes recently developed methods for interpolation between order statistics to provide interval coverage probabilities that are closer to the nominal confidence level.
Chapters 6
and
7
(on statistical intervals for the binomial and Poisson distributions, respectively) now include approximate procedures with improved coverage probability properties for constructing statistical intervals for discrete distributions.
In addition, we have updated the discussion in the original chapters in numerous places. For example, Chapter 1 now includes a section on statistical intervals and big data.
New Technical Appendices
Some readers of the first edition indicated that they would like to see the theory, or at least more technical justification, for the statistical interval procedures. In response, we added a series of technical appendices that provide details of the theory upon which most of the intervals are based and how their statistical properties can be computed. These appendices also provide readers additional knowledge useful in generalizing the methods and adapting them to situations not covered in this book. We maintain, however, our practitioner-oriented focus by placing such technical material into appendices.
The new appendices provide:
Generic definitions of statistical intervals and development of formulas for computing coverage probabilities (
Appendix B
).
Properties of probability distributions that are important in data analysis applications or useful in constructing statistical intervals (
Appendix C
).
Some generally applicable results from statistical theory and their use in constructing statistical intervals, including an outline of the general maximum likelihood theory concepts used in
Chapter 12
and elsewhere (
Appendix D
).
An outline of the theory for constructing statistical intervals for parametric distributions based on pivotal quantities used in
Chapters 3
,
4
, and
14
(
Appendix E
).
An outline of the theory for constructing statistical intervals for parametric distributions based on generalized pivotal quantities used in
Chapter 14
(
Appendix F
).
An outline of the theory for constructing distribution-free intervals based on order statistics, as presented in
Chapter 5
(
Appendix G
).
Some basic results underlying the construction of the Bayesian intervals used in
Chapters 15
,
16
, and
17
(
Appendix H
).
Derivation of formulas to compute the probability of successfully passing a (product) demonstration test based on statistical intervals described in
Chapter 9
(
Appendix I
).
Similar to the first edition, Appendices A and J of the new edition provide, respectively, a summary of notation and acronyms and important tabulations for constructing statistical intervals.
Computer Software
Many commercial statistical software products (e.g., JMP, MINITAB, SAS, and SPSS) compute statistical intervals. New versions of these packages with improved capabilities for constructing statistical intervals, such as those discussed in this book, are released periodically. Therefore,instead of directly discussing current features of popular software packages—which might become rapidly outdated—we provide this information in an Excel spreadsheet accessible from the book’s webpage and plan to update this webpage to keep it current.
In many parts of this book we show how to use the open-source R system (http://www.r-project.org/) as a sophisticated calculator to compute statistical intervals. To supplement the capabilities in R, we have developed an R package StatInt that contains some additional functions that are useful for computing statistical intervals. This package, together with its documentation, can be downloaded (for free) from this book’s webpage.
More on Book’s Webpage
The webpage for this book, created by Wiley, can be found at www.wiley.com/go/meeker/ intervals. In addition to the link to the StatIntR package and the Excel spreadsheet on current statistical interval capabilities of popular software, this webpage provides some tables and figures from the first edition that are omitted in the current edition, as well as some additional figures and tables, for finding statistical intervals.
We plan to update this webpage periodically by adding new materials and references, (numerous, we hope) reader comments and experiences, and (few, we hope) corrections.
Summary of Changes from First Edition
Principally for readers of the first edition, we summarize below the changes we have made in the new edition. Chapters 1–10 maintain the general structure of the first edition, but, as we have indicated, include some important updates, and minor changes in the notation, organization, and presentation. Also, new Chapter 11 is an update of old Chapter 13. To complement Chapter 11, we have added the new Chapter 18 which provides advanced case studies that require use of the methods presented in the new chapters. First edition Chapters 11 (“A Review of Other Statistical Intervals”) and 12 (“Other Methods for Setting Statistical Intervals”) have been omitted in the new edition. The old Chapter 12 is largely superseded and expanded upon by the new Chapters 12–18. Our previous comments in the old Section 11.1 (on simultaneous statistical intervals) now appear, in revised form, in Section 2.9. Some material from the old Sections 11.4 (“Statistical Intervals for Linear Regression Analysis”) and 11.5 (“Statistical Intervals for Comparing Populations and Processes”) is now covered in the new Sections 4.13 and 4.14, respectively. Most remaining material in the old Chapter 11 has been excluded in the new edition because the situations discussed can generally be better addressed from both a statistical and computational perspective by using the general methods in the new chapters. To make room for the added topics, we have dropped from the earlier edition various tables that are now, for the most part, obsolete, given the readily available computer programs to construct statistical intervals. We do, however, retain those tables and charts that continue to be useful and that make it easy to compute statistical intervals without computer software. In addition, the webpage provides some tabulations that were in the first edition, but not in this edition. We also omit Appendix C of the first edition (“Listing of Computer Subroutines for Distribution-Free Statistical Intervals”). This material has been superseded by the methods described in Chapter 5.
Happy reading!
WILLIAM Q. MEEKER GERALD J. HAHN LUIS A. ESCOBAR June 15, 2016
Preface to First Edition
Engineers, managers, scientists, and others often need to draw conclusions from scanty data. For example, based upon the results of a limited sample, one might need to decide whether a product is ready for release to manufacturing, to determine how reliable a space system really is, or to assess the impact of an alleged environmental hazard. Sample data provide uncertain results about the population or process of interest. Statistical intervals quantify this uncertainty by what is referred to, in public opinion polls, as “the margin of error.” In this book, we show how to compute such intervals, demonstrate their practical applications, and clearly state the assumptions that one makes in their use. We go far beyond the discussion in current texts and provide a wide arsenal of tools that we have found useful in practical applications.
We show in the first chapter that an essential initial step is to assure that statistical methods are applicable. This requires the assumption that the data can be regarded as a random sample from the population or process of interest. In evaluating a new product, this might necessitate an evaluation of how and when the sample units were built, the environment in which they were tested, the way they were measured—and how these relate to the product or process of interest. If the desired assurance is not forthcoming, the methods of this book might provide merely a lower bound on the total uncertainty, reflecting only the sampling variability. Sometimes, our formal or informal evaluations lead us to conclude that the best way to proceed is to obtain added or improved data through a carefully planned investigation.
Next, we must define the specific information desired about the population or process of interest. For example, we might wish to determine the percentage of nonconforming product, the mean, or the 10th percentile, of the distribution of mechanical strength for an alloy, or the maximum noise that a customer may expect for a future order of aircraft engines.
We usually do not have unlimited data but need to extract the maximum information from a small sample. A single calculated value, such as the observed percentage of nonconforming units, can then be regarded as a “point estimate” that provides a best guess of the true percentage of nonconforming units for the sampled process or population. However, we need to quantify the uncertainty associated with such a point estimate. This can be accomplished by a statistical interval. For example, in determining whether a product design is adequate, our calculations might show that we can be “reasonably confident” that if we continue to build, use, and measure the product in the same way as in the sample, the long-run percentage of nonconforming units will be between 0.43 and 1.57%. Thus, if our goal is a product with a percentage nonconforming of 0.10% or less, the calculated interval is telling us that additional improvement is needed—since even an optimistic estimate of the nonconforming product for the sampled population or process is 0.43%. On the other hand, should we be willing to accept, at least at first, 2% nonconforming product, then initial product release might be justified (presumably, in parallel with continued product improvement), since this value exceeds our most pessimistic estimate of 1.57%. Finally, if our goal had been to have less than 1% nonconforming product, our results are inconclusive and suggest the need for additional data.
Occasionally, when the available sample is huge (or the variability is small), statistical uncertainty is relatively unimportant. This would be the case, for example, if our calculations show that the proportion nonconforming units for the sampled population or process is between 0.43 and 0.45%. More frequently, we have very limited data and obtain a relatively “huge” statistical interval, e.g., 0.43 to 37.2%. Even in these two extreme situations, the statistical interval is useful. In the first case, it tells us that, if the underlying assumptions are met, the data are sufficient for most practical needs. In the second case, it indicates that unless more precise methods for analysis can be found, the data at hand provide very little meaningful information.


