
89,99 €
Mehr erfahren.
- Herausgeber: Thieme
- Kategorie: Fachliteratur
- Sprache: Englisch
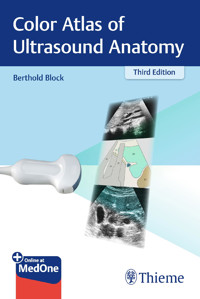
The third edition of this practical reference guide has been updated with a modern, visually attractive design and expanded content. The book is ideal for healthcare professionals with little or no experience in administering and interpreting abdominal ultrasound examinations. It is practice-oriented and structured in a way that allows readers with varying degrees of ultra-sonography knowledge to utilize the material according to their individual experience and needs.
Each chapter includes a systematic, detailed description of the anatomy involved in the ultrasound examination, with easy-to-digest steps that follow standardized routine and protocol. That straight-forward approach, coupled with more than 1,000 high-quality images and illustrations, enables hands-on learning, yielding the ability to assimilate these techniques quickly and adeptly.
This is a stellar resource that provides the requisite tools to locate and display the anatomical structure being tested, position and move the transducers accurately, describe and interpret the findings correctly, and differentiate key findings from the many image artifacts that typically occur.
Key Highlights:
- In-depth discussion of organ boundaries, organ details, anatomical relationships, potentially abnormal findings, tips, and clearly defined learning objectives
- Anatomical drawings incorporate a "sliced 3-D" view that show how the structures are displayed by the sector-shaper beam
- Each chapter includes a series of images replicating the 3-D impression that results from the transducer moving across the body
- Schematic drawings illustrate the ultrasound images, including a body marker that shows the transducer position
- The "sono-consultant": a systematic guide to evaluating ultrasound findings and establishing a differential diagnosis
This step-by-step guide is an invaluable, pragmatic resource to have on hand while performing abdominal ul
Das E-Book können Sie in Legimi-Apps oder einer beliebigen App lesen, die das folgende Format unterstützen:
Seitenzahl: 320
Veröffentlichungsjahr: 2015
Ähnliche


Abdominal Ultrasound: Step by Step
3rd Edition
Berthold Block, MD
Private PracticeBraunschweig, Germany
1035 illustrations
ThiemeStuttgart • New York • Delhi • Rio de Janeiro
Library of Congress Cataloging-in-Publication Data
Block, Berthold, author. [Sono-Trainer. English] Abdominal ultrasound: step by step/Berthold Block; translation by Terry C. Telger. – 3rd edition. p.; cm. This book is an authorized translation of the 5th German edition of Der Sono-Trainer: Schritt-fur-Schritt-Anleitungen fur die Oberbauchsonographie, published in 2014 by Georg Thieme Verlag, Stuttgart. Includes index. ISBN 978-3-13-138363-1 (alk. paper) – ISBN 978-3-13-164563-0 (eISBN) I. Telger, Terry C., translator. II. Title. [DNLM: 1. Abdomen–ultrasonography–Handbooks. 2. Diagnostic Techniques, Digestive System–Handbooks. 3. Digestive System– ultrasonography–Handbooks. 4. Ultrasonography–methods– Handbooks. 5. Urogenital System–ultrasonography–Handbooks. WI 39] RC944 617.5'507543–dc232015026407
This book is an authorized translation of the 5th German edition published and copyrighted 2014 by Georg Thieme Verlag, Stuttgart. Title of the German edition: Der Sono-Trainer: Schritt-für-Schritt-Anleitungen für die Oberbauchsonografie.
Original translation by: Terry C. Telger, Fort Worth, TX, USA
New updated parts translated by: Sarah Venkata, Medical Linguist/Medical Writer & Journalist, London, UK
Illustrator: Viorel Constantinescu, Bucharest, Romania,and Joerg Decker, Stuttgart, Germany
2nd English edition 2012
5th German edition 2014
1st Chinese (Taiwan) edition 2015
1st French edition 2005
1st Korean edition 2005
1st Polish edition 2013
1st Russian edition 2007
1st Spanish edition 2011
© 2004, 2016 Georg Thieme Verlag KG
Thieme Publishers StuttgartRüdigerstrasse 14, 70469 Stuttgart, Germany+49 [0]711 8931 421, [email protected]
Thieme Publishers New York333 Seventh Avenue, New York, NY 10001, USA+1-800-782-3488, [email protected]
Thieme Publishers DelhiA-12, Second Floor, Sector-2, Noida-201301, Uttar Pradesh, India+ 91 120 45 566 00, [email protected]
Thieme Publishers Rio, Thieme Publicações Ltda.Edifício Rodolpho de Paoli, 25° andar, Av. Nilo Peçanha, 50 – Sala 2508Rio de Janeiro 20020-906 Brasil+ 55 21 3172 2297/+ 55 21 3172 1896
Cover design: Thieme Publishing GroupTypesetting by Ziegler + Müller, Kirchentellinsfurt, Germany
Printed in Germany by appl druck, Wemding
ISBN 978-3-13-138363-1
54321
Also available as an e-book:eISBN 978-3-13-164563-0
Important note: Medicine is an ever-changing science undergoing continual development. Research and clinical experience are continually expanding our knowledge, in particular our knowledge of proper treatment and drug therapy. Insofar as this book mentions any dosage or application, readers may rest assured that the authors, editors, and publishers have made every effort to ensure that such references are in accordance with the state of knowledge at the time of production of the book.
Nevertheless, this does not involve, imply, or express any guarantee or responsibility on the part of the publishers in respect to any dosage instructions and forms of applications stated in the book. Every user is requested to examine carefully the manufacturers’ leaflets accompanying each drug and to check, if necessary in consultation with a physician or specialist, whether the dosage schedules mentioned therein or the contraindications stated by the manufacturers differ from the statements made in the present book. Such examination is particularly important with drugs that are either rarely used or have been newly released on the market. Every dosage schedule or every form of application used is entirely at the user's own risk and responsibility. The authors and publishers request every user to report to the publishers any discrepancies or inaccuracies noticed. If errors in this work are found after publication, errata will be posted at www.thieme.com on the product description page.
Some of the product names, patents, and registered designs referred to in this book are in fact registered trademarks or proprietary names even though specific reference to this fact is not always made in the text. Therefore, the appearance of a name without designation as proprietary is not to be construed as a representation by the publisher that it is in the public domain.
This book, including all parts thereof, is legally protected by copyright. Any use, exploitation, or commercialization outside the narrow limits set by copyright legislation, without the publisher's consent, is illegal and liable to prosecution. This applies in particular to photostat reproduction, copying, mimeographing, preparation of microfilms, and electronic data processing and storage.
Contents
Preface
General Basics
1 General
1.1 How to Use This Book
1.2 Examination Technique and Equipment
Who do you examine first when learning to scan?
How do you adjust the ultrasound machine?
What can you do with the transducer?
2 Basic Physical and Technical Principles
2.1 Ultrasound
Definitions
Propagation of sound
Production and detection of ultrasound waves: the pulse-echo principle
Diagnostic ultrasound: propagation of ultrasound in biological tissue
2.2 Producing an Image
A-Mode
B-Mode
M-Mode
2.3 Artifacts
Noise
Acoustic shadowing
Posterior acoustic enhancement
Reverberations
Beam-width artifact
Side-lobe artifact
Mirror-image artifact
Lateral edge shadow
Abdominal Ultrasound
3 Blood Vessels: The Aorta and Its Branches, the Vena Cava and Its Tributaries
3.1 Preliminary Remarks
3.2 Locating the Aorta and Vena Cava
3.3 Imaging the Aorta and Vena Cava in Their Entirety
Demonstrating the aorta and vena cava in transverse section
Demonstrating the aorta and vena cava in longitudinal section
Abnormalities in the course of the aorta
3.4 Organ Details
Demonstrating arterial and venous pulsations
Evaluating the vessel walls and lumina
Identifying and defining the branches of the aorta and vena cava
3.5 Anatomical Relationships
Relationship of the aorta and vena cava to the diaphragm, liver, and cardia
Area surrounding the celiac trunk and the course of the hepatic artery, splenic artery, and left gastric artery
Superior mesenteric artery, splenic vein, and renal vessels
Iliac vessels
Lymph nodes near the retroperitoneal vessels
4 Liver
4.1 Preliminary Remarks
4.2 Locating the Liver
4.3 Imaging the Liver in Its Entirety
Outlines of the liver
Systematic survey of liver volume
4.4 Organ Details
Shape
Size
Parenchymal pattern
Vessels of the liver
Division of the liver into lobes, segments, and subsegments
The portal vein and its branches
4.5 Anatomical Relationships
Relationship of the left portion of the liver
Relationship of the central portion of the liver
Relationships of the right portion of the liver
Ascites
5 Porta Hepatis
5.1 Preliminary Remarks
5.2 Locating the Porta Hepatis
5.3 Systematic Definition of the Porta Hepatis in Transverse and Longitudinal Sections
Defining the porta hepatis in transverse sections
Defining the porta hepatis in longitudinal sections
5.4 Organ Details: Details of the Vessels in the Porta Hepatis
Portal vein
Bile duct
6 Gallbladder
6.1 Preliminary Remarks
6.2 Locating the Gallbladder
6.3 Imaging the Entire Gallbladder
Defining the gallbladder in upper abdominal transverse scans
Defining the gallbladder in upper abdominal longitudinal scans
Locating and defining the gallbladder with intercostal flank scans
Variable position of the gallbladder
Nonvisualization of the gallbladder
6.4 Organ Details
Regions of the gallbladder
Size of the gallbladder
Variable shape of the gallbladder
Gallbladder wall
Gallbladder contents
Special acoustic phenomena in gallbladder scanning
6.5 Anatomical Relationships
Relationship of the gallbladder to the liver
Relationship of the gallbladder to the portal vein
Relationship of the gallbladder to the antrum, bulb, and duodenum
7 Pancreas
7.1 Preliminary Remarks
7.2 Locating the Pancreas Anteriorly
7.3 Imaging the Entire Pancreas
Defining the pancreas in upper abdominal transverse scans
Defining the pancreas in upper abdominal longitudinal scans
Scanning the tail of the pancreas through the spleen
Variable shape of the pancreas
7.4 Organ Details
Pancreatic parenchyma
Pancreatic duct
Common bile duct
Measuring the pancreatic diameter
7.5 Anatomical Relationships
Relationships of the tail of the pancreas
Relationships of the body of the pancreas
Relationships of the head of the pancreas
8 Stomach, Duodenum, and Diaphragm
8.1 Preliminary Remarks
8.2 Locating the Stomach, Duodenum, and Diaphragm
8.3 Organ Details
Stomach wall
Changes in the stomach wall
8.4 Organ Boundaries and Relationships
Esophagus and cardia
Body of the stomach
Antrum and duodenum
Diaphragm
9 Spleen
9.1 Preliminary Remarks
9.2 Locating the spleen
9.3 Imaging the Spleen in Its Entirety
Defining the spleen in longitudinal sections
Defining the spleen in transverse sections
9.4 Organ Details
Shape of the spleen
Determining the size of the spleen
Echo pattern
9.5 Anatomical Relationships
Relationship of the spleen to the pancreas, kidney, colic flexure, and stomach
Relationship of the spleen to the pleura
Abnormalities associated with the spleen
10 Kidneys
10.1 Preliminary Remarks
10.2 Locating the Kidneys
10.3 Imaging the Kidneys in Their Entirety
Longitudinal flank scan of the right kidney
Transverse flank scan of the right kidney
Longitudinal flank scan of the left kidney
Transverse flank scan of the left kidney
Abnormalities in locating the kidneys
10.4 Organ Details
Size and shape of the kidneys
Renal parenchyma and renal sinus
10.5 Anatomical Relationships of the Right Kidney
Relationship of the right kidney to the liver
Relationship of the right kidney to the psoas and quadratus lumborum muscles
Relationship of the right kidney to the colon
Relationship of the right kidney to the gallbladder
10.6 Anatomical Relationships of the Left Kidney
Relationship of the left kidney to the spleen
Relationship of the left kidney to the psoas and quadratus lumborum muscles
Relationship of the left kidney to the colon
11 Adrenal Glands
11.1 Preliminary Remarks
11.2 Locating the Adrenal Glands
11.3 Imaging the Adrenal Glands
Right adrenal gland
Left adrenal gland
11.4 Organ Details
Abnormalities of the adrenal glands
12 Bladder, Prostate, and Uterus
12.1 Preliminary Remarks
12.2 Locating the Bladder, Prostate, and Uterus
12.3 Imaging the Bladder and Prostate or Uterus in Their Entirety
Demonstrating the bladder and prostate in transverse section
Demonstrating the bladder and prostate in longitudinal section
Demonstrating the bladder and uterus in transverse section
Demonstrating the bladder and uterus in longitudinal section
12.4 Organ Details
Bladder and prostate
Uterus
Brief Instructions and Documentation
13 Quick Guide
13.1 Vessels
Examination targets
Assessment of
Locating
Standard slices
Assessment
Normal values
Abnormalities and variants, pitfalls
13.2 Liver
Examination targets
Locating
Standard slices
Assessment
Normal values
Abnormalities and variants, pitfalls
13.3 Porta Hepatis
Examination targets
Locating
Standard slices
Assessment
Normal values
Abnormalities
13.4 Gallbladder
Examination targets
Locating
Standard slices
Assessment
Normal values
Abnormalities and variants, pitfalls
13.5 Pancreas
Examination targets
Locating
Standard slices
Assessment
Normal values
13.6 Stomach, Duodenum, and Diaphragm
Examination targets
Locating
Standard slices
Assessment
13.7 Spleen
Examination targets
Locating
Standard slices
Assessment
Normal values
Abnormalities and variants, pitfalls
13.8 Kidneys
Examination targets
Locating
Standard slices
Assessment
Normal values
Abnormalities and variants, pitfalls
13.9 Adrenal Glands
Examination targets
Locating
Standard slices
Assessment
13.10 Bladder, Prostate, and Uterus
Examination targets
Locating
Standard slices
Assessment
Normal values
14 The Sono Consultant
14.1 Ultrasound Findings
14.2 Clinical Presentation
15 Documentation
15.1 Guidelines
15.2 Practical Application
Written report
Nomenclature
Aid to formulating organ-related findings
Image documentation
Index
Normal Ultrasound Measurement Values
Preface
The first edition was published in 2004 as The Practice of Ultrasound. My goal at that time was to walk the user through the basic principles of upper abdominal ultrasound scanning. I am pleased that this concept is being revived and that a third edition of the book can now be published. Once again the author recommends keeping the book close at hand during the ultrasound examination.
Chapter 14 of this edition serves as a “Sono Consultant.” It has been designed to provide systematic guidance in interpreting suspicious findings and determining how ultrasound can be applied to specific clinical questions.
I wish my readers success in learning this modality and hope that they enjoy the practice of abdominal ultrasound scanning.
Berthold Block, MD
General Basics
1 General
2 Basic Physical and Technical Principles
1 General
1.1 How to Use This Book
This book is a self-study guide, designed to enable you to begin scanning a live subject right away, without any prior theoretical knowledge of ultrasonography. Different readers will have different degrees of experience with ultrasound. Therefore the book is structured so that you can access the material at your own level of knowledge and experience. Because the book is practiceoriented, less emphasis is placed on physical and technical details, which are basically limited to the following three questions:
LEARNING GOALS
• Who do you examine first when learning ultrasound?
• How do you adjust the ultrasound machine?
• What can you do with the transducer?
After addressing these questions, we will cover the practical aspects of performing an upper abdominal ultrasound examination according to a standardized routine. The protocol for examining the major abdominal organs—liver, gallbladder, pancreas, kidneys, spleen, vena cava, and aorta—proceeds from the simple to the more complex: First, you locate the organ of interest and demonstrate it in its entirety. Second, you define the organ details. Third, you evaluate the relations of the organ to surrounding structures.
KEY POINTS
Locate and survey the organ.
Define the details of the organ.
Define its relations to neighboring structures.
In theory, then, there are two basic strategies for scanning the upper abdomen:
• Organ-oriented: an organ or structure is identified, scrutinized, and evaluated in relation to surrounding structures.
• Level-oriented: the abdominal organs are examined as a whole, proceeding in steps. First, all of the abdominal organs are successively located and surveyed. Next the organ details are defined, and finally the interrelationships of all the organs are evaluated.
In practice, you will generally apply a combination of both strategies. But in all cases you will learn to follow a structured, step-by-step protocol that is the essence of systematic upper abdominal ultrasound.
Smaller organs and structures of the upper abdomen will be covered in a less formalized way: the stomach, duodenum, porta hepatis, and adrenal glands.
1.2 Examination Technique and Equipment
Who do you examine first when learning to scan?
You should select a young, slender, fasting subject and examine him or her in the morning if at all possible. If you meet these criteria yourself, you should know that self-examination can be mastered with very little practice. You just have to reorient your thinking compared with examining another person, and this can be done relatively quickly.
How do you adjust the ultrasound machine?
The ultrasound system consists of the ultrasound machine itself, the transducer (probe), and the monitor (screen). Each of these elements affects the quality of the examination.
Ultrasound machine
As a beginner, you should not try to learn all the fine points of “knobology” right away. You should, however, be familiar with all of the functions shown in Fig. 1.1.
Fig. 1.1 Control panel of an ultrasound machine.
1 On/off switch
2 Freeze button
3 Transducer selector switch
4 Penetration depth
5 Power output
6 Time-gain compensation (TGC)
On switch. Turns the machine on and off.
Freeze button. If the machine was used earlier, the previous operator may have activated the freeze button, locking out all the function switches. In this case you must turn off the freeze switch before using the machine.
Transducer selector switch. More than one transducer may be available for use. You can choose the desired transducer with a selector switch. To begin with, select the 3.5 MHz curved array. Further details on this type of transducer are given in the “Transducers” section below.
Penetration depth. You turn a knob to set the penetration depth of the ultrasound scan. This has the effect of widening or narrowing the image field. Start with the control set to 12 cm. Most of the images in this book were obtained at this setting.
Power output, overall gain, and time-gain compensation. Recall for a moment the way that diagnostic ultrasound works. Ultrasound waves are transmitted, partially reflected by tissues, and received. The intensity of both the transmitted waves and the received signals can and should be adjusted and optimized. The power transmitted by the system, called the power output, affects the brightness of the image. A low power output produces a dark image, while a high power output yields a bright image. The overall gain also affects image brightness. A dark image at a low power setting can be brightened by increasing the gain, and a bright image can be darkened by lowering the gain. Both functions should be carefully balanced to obtain a quality image. A good general rule is to set the power output to the lowest possible level. On the other hand, setting the gain too high to compensate for a low power setting will produce a “noisy” image. Through practice, you will learn how to achieve a proper balance.
Tip
Set the power output to an intermediate setting, and move all the TGC slide switches to the center. Adjust the overall gain to obtain good mid-field brightness. Now adjust the slide switches to produce uniform brightness in the near and far fields. When this is done correctly, the slide switches will usually form an approximate diagonal line.
Every ultrasound machine has two gain controls. The overall gain control is used to amplify the received echoes over the entire depth of the image field. The time-gain compensation (TGC) amplifies echoes according to their depth to achieve uniform image brightness.
Transducers
Three different transducers are important for routine scanning: the sector transducer, linear transducer, and curved array (Fig. 1.2).
Fig. 1.2 Principal transducer designs.
a Sector transducer.
b Linear transducer.
c Curved array.
Sector transducer. In a sector transducer (Fig. 1.2 a), the ultrasound beam is moved through a fan-shaped sector either mechanically (by rotary movement of the transducer elements) or electronically (by sequential firing of the elements). The ultrasound image is narrow at close range and widens out with distance from the transducer face.
• Advantages: small footprint, ability to scan through a small acoustic window, clear definition of structures at greater depths.
• Disadvantage: poor resolution of structures near the transducer.
Linear transducer. In a linear transducer (Fig. 1.2 b), multiple parallel elements are arranged in a straight line, producing a rectangular image field.
• Advantage: good resolution of structures near the transducer.
• Disadvantages: large footprint, cannot scan through a narrow acoustic window close to the transducer.
Curved array. In a curved array (Fig. 1.2 c), the piezoelectric elements are lined up as in a linear transducer, but on a convex surface. This produces a fan-shaped image similar to that of a sector transducer but considerably wider in the near field.
• Advantage: compromise between a sector and linear transducer.
• Disadvantage: line density decreases with depth, as in a sector transducer.
KEY POINTS
Sector and curved-array transducers produce a fan-shaped beam. A linear transducer has parallel elements that produce a rectangular beam.
Frequency. Besides the shape of the transducer and the arrangement of the elements, image quality is determined by the frequency of the emitted sound. Frequencies in the range of 2.5 to 7.5 MHz are generally used for diagnostic ultrasound. High frequencies provide less penetration depth with higher resolution, while low frequencies give deeper penetration with lower resolution. Transducers with an operating frequency of 3.5 MHz are commonly used for upper abdominal scanning. Most of the images in this book were obtained with a 3.5 MHz curved array.
Adjusting the monitor
You can adjust the monitor's brightness and contrast. Adjust the brightness level so that you can distinguish the background brightness of the monitor image from the structures surrounding the image. Then adjust the contrast to a level at which you can distinguish all shades of gray in the gray bars.
What can you do with the transducer?
You use the transducer to obtain a two-dimensional sectional image of the body that is displayed on the monitor. Structures located closer to the transducer are displayed at the top of the screen, and structures farther away are displayed at the bottom. All other localizing information—right/left, cranial/caudal, lateral/medial, and posterior/anterior—depends on how the transducer is positioned.
Transducer position
To aid in understanding the transducer and how it is positioned, we will first reduce the infinite number of possible scan planes through the body to three cardinal planes of section: transverse, longitudinal, and coronal.
Transverse section. The transducer is placed to scan a cross section of the body. Structures located on the right side of the body may be displayed on the left or right side of the screen, depending on how the transducer is rotated. You should always position the transducer so that the right side of the body is displayed on the left side of the screen. You will then be viewing the section from below upward, as in a CT scan (Fig. 1.3).
Fig. 1.3 Plane of section of a transverse scan.
Fig. 1.4 Plane of section of a longitudinal scan.
Fig. 1.5 Plane of section of a coronal scan from the right side.
Fig. 1.6 Plane of section of a coronal scan from the left side.
Longitudinal section. The transducer is placed parallel to the long axis of the body. Cranial or caudal body structures may be displayed on the left side of the screen, depending on how the transducer is rotated. Always place the transducer so that cranial structures appear on the left side of the screen, i.e., you are looking into the body from right to left (Fig. 1.4).
Coronal section. The transducer is placed on the side of the body to scan a frontal (coronal) section. As in a longitudinal scan, position the transducer so that cranial body structures are displayed on the left side of the screen and caudal structures on the right. Anterior/posterior orientation depends on whether you are scanning from the patient's right or left side. With a coronal scan from the right side, you are viewing the body from the back (Fig. 1.5). When you scan from the left side, you are viewing the body from the front (Fig. 1.6).
KEY POINTS
The three cardinal planes of section through the body are transverse, longitudinal, and coronal.
Fig. 1.7 Standard scan planes used in abdominal ultrasound
a Upper abdominal transverse scan.
b Oblique subcostal scan, right or left.
c High lateral intercostal scan, right or left.
d Intercostal scan, right or left.
e Extended intercostal scan, right or left.
f Flank scan, right or left.
g Midabdominal transverse scan, right or left.
h Upper abdominal longitudinal scan.
i Parasagittal scan, right or left.
j Lower abdominal longitudinal scan.
k Lower abdominal transverse scan.
Routine scan planes. Now you know the three standard planes for routine scanning: transverse, longitudinal, and coronal. These planes can be combined in an infinite variety of ways, of course, but a limited number of scan planes have become important in the routine practice of abdominal ultrasound. Different authors have defined the number and nomenclature of these “standard views” and the corresponding transducer placements differently. The most frequently described abdominal scans are shown in Figure 1.7.
Transducer movements
Once you have grasped the basics of transducer placement, you should become familiar with the basic patterns of transducer movement. Position the transducer for an upper abdominal transverse scan. The transducer can now be moved according to the patterns shown in Fig. 1.8.
Perform each of these movements with the transducer, sticking closely to the patterns indicated for the time being. In an actual examination, of course, you would generally use various combinations of these patterns, but the beginner often encounters problems by using unintended or unwanted combinations of transducer movements. You should always be aware of the movements that you are making with the transducer.
KEY POINTS
There are five basic patterns of transducer movement:
• Sliding on the flat
• Sliding on edge
• Angulation
• Rocking
• Rotation
Fig. 1.8 Basic types of transducer movement
Sliding on the flat. When you move the transducer across the skin with the flat side leading, you obtain a series of parallel scans that you can easily relate to one another during the examination. This is the easiest way to create a three-dimensional spatial impression from a set of two-dimensional slices. The beginner should make a special effort to keep the scans parallel to one another. Frequently, the sliding movement is combined with unwanted angulation of the probe. We can illustrate this with an example. Position the transducer for an upper abdominal longitudinal scan. Move the transducer laterally, keeping it at a constant vertical angle, while watching the image on the screen. You will obtain parallel sagittal sections (Fig. 1.9 a). Now repeat this movement but keep the transducer perpendicular to the body surface. Notice that the transducer starts in a sagittal plane but ends up in a coronal plane because you have added angulation to the lateral movement (Fig. 1.9 b).
Fig. 1.9 Sliding the transducer on the flat, with and without angulation
Sliding on edge. When you move the transducer across the skin with the narrow edge leading, you extend the field of view without leaving the initial scan plane. As a result, this maneuver does not provide a three-dimensional impression but an extended two-dimensional view (Fig. 1.10 a). This movement is often combined with unintended rocking of the probe (Fig. 1.10 b).
Fig. 1.10 Sliding the transducer on the flat, with and without a rocking motion
Angling. Angling (tilting) the transducer produces a series of fan-shaped scans. This movement can give a good three-dimensional impression of the scanned anatomy, but extreme tilting of the probe can make spatial visualization difficult, as illustrated in Fig. 1.11 This type of section can be extremely difficult for a beginner to interpret during the examination.
Fig. 1.11 Angling the transducer. Section 1 is a standard transverse scan, with the examiner looking up into the body from below. Section 2 is an oblique scan, which the examiner is viewing at a more posterior angle. Section 3 is almost in a coronal plane. The examiner is viewing this section from behind, so that the body is projected “upside down.”
Angling the transducer is a useful technique for making narrow sweeps and for scanning through acoustic windows to avoid barriers located near the transducer.
Rocking. This movement, like sliding the transducer on edge, keeps to the initial scan plane and does not convey a three-dimensional impression. However, it can extend the field of view when scanning through a narrow acoustic window.
Rotation. Rotation is usually combined with a sliding movement of the transducer. It is useful for obtaining a continuous view of curved anatomical structures.
Isolated transducer rotation, in which the probe is turned about its central axis, can be used to demonstrate a structure in a second plane. For example, a vascular segment will appear circular in transverse section but elongated in the second plane, whereas a cyst will appear circular in both planes.
2 Basic Physical and Technical Principles
You now know how to adjust the ultrasound machine, how to optimize the image quality, and how to use the transducer. You are ready to begin scanning.
If you like, you may skip the following section and return to it later if you need to. It provides a brief review of the basic physical and technical principles of diagnostic ultrasound.
LEARNING GOALS
• Understand the production, propagation, and detection of ultrasound.
• Learn the differences between A-mode, B-mode, and M-mode scanning.
• Be able to recognize and distinguish artifacts.
2.1 Ultrasound
Definitions
Sound is a mechanical wave that travels longitudinally through an elastic medium.
Ultrasound is sound at a frequency beyond the range of human hearing. The frequency range of diagnostic ultrasound is between 1 and 20 MHz.
Propagation of sound
Reflection and refraction. When sound encounters a boundary between two media of different densities, some of the sound “bounces” back toward the source as an echo. The angle of incidence of the sound is equal to the angle at which the echo is returned. This phenomenon is called reflection. The rest of the sound continues to travel through the second medium but is deflected from its original path. This phenomenon is called refraction.
Impedance. Acoustic impedance is the measure of resistance to the propagation of sound waves. It is the product of the density of a medium and the velocity of sound in the medium. When there is a large difference in acoustic impedance between two adjacent media, a large portion of the sound will be reflected at the interface between the media.
KEY POINTS
The propagation of sound is affected by reflection, refraction, and absorption.
Absorption. As a sound wave propagates through matter, some of its energy is converted by friction into heat. This loss of sound energy is called absorption.
Scatter. Besides reflection and refraction, scatter is another phenomenon that is important in the propagation of ultrasound. When ultrasound waves encounter a nonhomogeneous medium or a “rough” surface, a small part of their energy is scattered away from the object, in random directions, while most of the sound continues to propagate. In diagnostic ultrasound, some of this scattered sound is radiated back toward the transducer and contributes to image formation.
Production and detection of ultrasound waves: the pulse-echo principle
Diagnostic ultrasound is based on the pulse-echo principle. The smallest functional unit of the ultrasound transducer is the piezoelectric crystal. This crystal has the property of converting electrical oscillations into mechanical vibrations, and vice versa. Thus, when the crystal is exposed to an alternating electric current, it will undergo mechanical deformation and generate sound waves. Conversely, when sound waves strike the crystal, they deform it and cause it to generate electrical impulses. One crystal can perform both functions in an alternating fashion.
First the piezoelectric crystal is exposed to an alternating electric field, causing it to vibrate. The transducer emits a short, intense burst (pulse) of sound. Immediately thereafter, the transducer switches to the “listening” mode. The echoes reflected from different interfaces successively return to the crystal and cause it to vibrate. These vibrations are converted to electrical impulses, which are used to reconstruct an image.
KEY POINTS
The piezoelectric crystals in a transducer emit sound pulses and also receive the echoes.
Diagnostic ultrasound: propagation of ultrasound in biological tissue
From an ultrasound standpoint, the human body is composed of three basic materials: gas, soft tissues, and bone (Table 2.1).
The very large difference in acoustic impedance that exists between air and tissue (“impedance mismatch”) causes 100% of the sound to be reflected at air/tissue interfaces. The impedance mismatch between bone and tissue is large enough to cause almost all of the sound to be reflected. The portion that continues to travel across the bone/tissue interface is too small to be utilized diagnostically. The small impedance mismatch that exists between different soft tissues is the basis for diagnostic ultrasound. Most of the sound waves are not reflected from the initial tissue layers and are available for scanning the deeper layers.
2.2 Producing an Image
The detection of the returning sound pulses supplies two critical types of information:
• The time that it takes for the echo to reach the receiver. This determines the location of the reflecting interface in the monitor image.
• The intensity of the echo. This depends on the difference in hardness at the interface between the adjacent sound-conducting media.
KEY POINTS
Two types of data—time and echo intensity—are used to make the acoustic signals visible in the A-mode, B-mode, and M-mode displays.
A-Mode
A stands for “amplitude.” The A-mode principle is as follows: A short ultrasound pulse is emitted and propagates through the tissue. The reflected echoes are displayed on a graph as vertical deflections along a time axis. The location of the deflections depends on the echo transit time, and their amplitude (height) depends on the intensity of the echoes.
B-Mode
B stands for “brightness.” In the B-mode, the returning echoes are displayed as shades of gray rather than deflections along a baseline. The echo amplitude is represented by a gray level ranging from black to white. Each signal that is received along an image line is displayed as a one-dimensional gray-scale spot, and the individual image lines are briefly stored. The acoustic axis of the transducer is swept through the tissues to acquire the total number of lines needed to make a sectional image. All of the image lines are then accessed and assembled on the monitor to create a two-dimensional B-mode image.
M-Mode
M stands for “motion.” The M-mode is used to display moving structures. As in B-mode, a gray-scale-modulated image line is produced. However, whereas the acoustic axis is moved in the two-dimensional B-mode display to acquire a large number of image lines, the acoustic axis in the M-mode display does not move. Instead, the same B-mode image line is displayed along a moving time base to graph the changing location of the mobile anatomical structures. Figure 2.1 shows an ultrasound beam crossing multiple interfaces and undergoing partial reflection at each interface. In A-mode, the location of an amplitude spike corresponds to the location of the interface, and the height of the spike is proportional to the echo intensity. In B-mode, the amplitude of the echo is represented by the gray level of the spot. The image line is still one-dimensional, and a number of adjacent lines must be assembled to create the familiar two-dimensional B-mode image. M-mode also utilizes the grayscale B-mode image line, but the acoustic axis remains stationary. The motion of reflective interfaces along the acoustic axis, as in the heart, alters the location of the signals displayed along the image line. Moving the recording paper creates a two-dimensional graphic record that documents the motion of the interfaces over time.
Fig. 2.1 A-mode, B-mode, and M-mode. Shown for an acoustic axis through the heart.
2.3 Artifacts
Artifacts in the ultrasound image are echoes that do not correspond to an anatomical structure. They result from the physical properties of ultrasound propagation in tissues.
Fig. 2.2 Noise. Section through a liver cyst. Myriad fine internal echoes (↑) are seen within the cyst close to the transducer.
Noise
Noise refers to the appearance of grainy echoes, especially in the proximal portion of cystic areas (Fig. 2.2). It is caused mainly by excessive gain in the near field. Noise can be reduced by lowering the gain setting.
Fig. 2.3 Acoustic shadow. This artifact appears as an echo-free streak behind a gallstone (→).
Acoustic shadowing
An acoustic shadow is an echo-free area located behind an insonated structure (Fig. 2.3). It is caused by total reflection (e.g., by air) or absorption (bone, gallstones) of the sound energy.
Posterior acoustic enhancement
In posterior acoustic enhancement, the area behind an echo-free structure appears more echogenic than its surroundings (Fig. 2.4). When the sound passes through the echo-free structure, typically a cyst, it undergoes very little energy loss and attenuation. Because of this, the area behind the cyst appears brighter in relation to the surrounding tissues. The term “enhancement” is somewhat misleading, as this phenomenon is actually due to decreased attenuation.
Reverberations
Reverberations occur in two typical forms: parallel bands of echoes spaced at equal intervals (Fig. 2.5 a) and a line of echoes resembling a comet tail (Fig. 2.5 b). Reverberations occur at the interfaces of adjacent media that differ greatly in their acoustic impedance. The ultrasound waves are partially reflected from the second interface, and some of these echoes are reflected again from the back of the first interface. This sets up repetitive back-and-forth reflections that either appear as distinct parallel bands (first form) or, at very strong reflectors, blend into a narrow streak resembling a comet tail (second form, also called a comet-tail artifact).
Fig. 2.4 Posterior acoustic enhancement. This artifact forms an echogenic streak in the liver tissue behind a cyst (→).
Fig. 2.5 Reverberations. Two different forms are shown
Beam-width artifact
The beam-width artifact (section-thickness artifact) appears as a collection of fine, grainy echoes distributed along the inside of cystic structures whose wall is struck obliquely by the ultrasound beam (Fig. 2.6). The main beam emitted by the transducer has a definite width. When the beam encounters an oblique interface, the beam width overlaps both the echo-free interior of the cyst and its highly reflective wall. Because the echogenicities of these different structures are averaged together electronically to form an image, smudgy echoes appear to line the cyst wall (pseudosludge).
Fig. 2.6 Beam-width artifact
Side-lobe artifact
Side-lobe artifacts are bright, curved lines that are usually seen in hypoechoic or echo-free structures (Fig. 2.7). They are caused by side lobes, which are secondary oblique concentrations of energy located off the main beam axis. When the echo from a side lobe reaches the receiver with sufficient energy, it is assigned to the main beam and is therefore displayed at a false location. Due to the low energy of the side lobe, a strong reflector (e.g., air) and hypoechoic or echo-free surroundings (gallbladder, large vessels) must be present in order for the artifact to be seen.
Fig. 2.7 Side-lobe artifact
Mirror-image artifact
A mirror-image artifact is the virtual image of a real object that forms behind a highly reflective interface (Fig. 2.8). It is caused by deflection of the beam at the “specular” reflector. The virtual image appears behind the interface in the path of the main beam.
Fig. 2.8 Mirror-image artifact
Lateral edge shadow
A lateral edge shadow is a thin acoustic shadow that appears distal to the lateral edges of a cystic structure (Fig. 2.9). It is caused by the refraction and scattering of sound striking the cyst wall at a tangential angle. Due to the energy loss that occurs, the sound does not propagate to deeper levels, and an acoustic shadow is formed.
Fig. 2.9 Lateral edge shadows
Abdominal Ultrasound
3 Blood Vessels: The Aorta and Its Branches, the Vena Cava and Its Tributaries
4 Liver
5 Porta Hepatis
6 Gallbladder
7 Pancreas
8 Stomach, Duodenum, and Diaphragm
9 Spleen
10 Kidneys
11 Adrenal Glands
12 Bladder, Prostate, and Uterus
3 Blood Vessels: The Aorta and Its Branches, the Vena Cava and Its Tributaries
3.1 Preliminary Remarks
LEARNING GOALS
• Locate and identify the aorta and vena cava.
• Demonstrate the aorta and vena cava in their entirety.
The aorta and vena cava run parallel, anterior, and slightly lateral to the spinal column in the retroperitoneum. Just below the diaphragm, the vena cava initially is slightly more anterior than the aorta and is surrounded predominantly by the liver. The aorta is covered by the esophagogastric junction as it pierces the diaphragm and is more difficult to image than the vena cava (Fig. 3.1


