19,99 €
Mehr erfahren.
- Herausgeber: John Wiley & Sons
- Kategorie: Ratgeber
- Sprache: Englisch
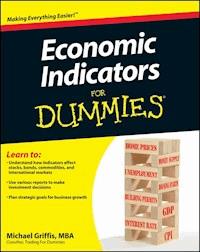
Everything you need to easily get a handle on economic indicators
In today's volatile, often troubling economic landscape, there are myriad statistics and reports that paint an economic picture that can sometimes resemble a work by Jackson Pollock. These complex and often-conflicting reports could vex even the savviest investor. Economic Indicators For Dummies explains how to interpret and use key global economic indicators to make solid investments, aid in business planning, and help develop informed decisions. In plain English, it breaks down the complex language and statistics to help you make sense of this critical information.
You'll discover how to interpret economic data within the context of other sometimes-conflicting reports and statistics, and use the information to make profitable decisions. You'll understand the meaning of such data as employment indices and housing and construction stats and how they affect stocks, bonds, commodities and international markets . . . and how you can use these statistics to make investment decisions as well as plan strategic goals for business growth. Economic Indicators For Dummies breaks down dozens of statistics and patterns to give you a better understanding of how various sources of data and information can be used.
- Breaks down jargon and statistical concepts
- Covers how to use publicly available economic indicators to better position your portfolio, improve returns, and make sensible, long-range business plans
- Discusses the reliability and timeliness of the collected data, while helping investors prioritize the flow of economic information to avoid information overload
Whether you're an investor, economics student, or business professional involved in making key strategic decisions for your company, Economic Indicators For Dummies has you covered.
Sie lesen das E-Book in den Legimi-Apps auf:
Seitenzahl: 563
Veröffentlichungsjahr: 2011
Ähnliche


Economic Indicators For Dummies®
Visit www.dummies.com/cheatsheet/economicindicators to view this book's cheat sheet.
Table of Contents
Economic Indicators For Dummies®
by Michael Griffis, MBA
Coauthor of Trading For Dummies
Economic Indicators For Dummies®
Published byJohn Wiley & Sons, Inc.111 River St.Hoboken, NJ 07030-5774
www.wiley.com
Copyright © 2011 by John Wiley & Sons, Inc., Hoboken, New Jersey
Published by John Wiley & Sons, Inc., Hoboken, New Jersey
Published simultaneously in Canada
No part of this publication may be reproduced, stored in a retrieval system or transmitted in any form or by any means, electronic, mechanical, photocopying, recording, scanning or otherwise, except as permitted under Sections 107 or 108 of the 1976 United States Copyright Act, without the prior written permission of the Publisher. Requests to the Publisher for permission should be addressed to the Permissions Department, John Wiley & Sons, Inc., 111 River Street, Hoboken, NJ 07030, (201) 748-6011, fax (201) 748-6008, or online at http://www.wiley.com/go/permissions.
Trademarks: Wiley, the Wiley logo, For Dummies, the Dummies Man logo, A Reference for the Rest of Us!, The Dummies Way, Dummies Daily, The Fun and Easy Way, Dummies.com, Making Everything Easier, and related trade dress are trademarks or registered trademarks of John Wiley & Sons, Inc., and/or its affiliates in the United States and other countries, and may not be used without written permission. All other trademarks are the property of their respective owners. John Wiley & Sons, Inc., is not associated with any product or vendor mentioned in this book.
LIMIT OF LIABILITY/DISCLAIMER OF WARRANTY: THE PUBLISHER AND THE AUTHOR MAKE NO REPRESENTATIONS OR WARRANTIES WITH RESPECT TO THE ACCURACY OR COMPLETENESS OF THE CONTENTS OF THIS WORK AND SPECIFICALLY DISCLAIM ALL WARRANTIES, INCLUDING WITHOUT LIMITATION WARRANTIES OF FITNESS FOR A PARTICULAR PURPOSE. NO WARRANTY MAY BE CREATED OR EXTENDED BY SALES OR PROMOTIONAL MATERIALS. THE ADVICE AND STRATEGIES CONTAINED HEREIN MAY NOT BE SUITABLE FOR EVERY SITUATION. THIS WORK IS SOLD WITH THE UNDERSTANDING THAT THE PUBLISHER IS NOT ENGAGED IN RENDERING LEGAL, ACCOUNTING, OR OTHER PROFESSIONAL SERVICES. IF PROFESSIONAL ASSISTANCE IS REQUIRED, THE SERVICES OF A COMPETENT PROFESSIONAL PERSON SHOULD BE SOUGHT. NEITHER THE PUBLISHER NOR THE AUTHOR SHALL BE LIABLE FOR DAMAGES ARISING HEREFROM. THE FACT THAT AN ORGANIZATION OR WEBSITE IS REFERRED TO IN THIS WORK AS A CITATION AND/OR A POTENTIAL SOURCE OF FURTHER INFORMATION DOES NOT MEAN THAT THE AUTHOR OR THE PUBLISHER ENDORSES THE INFORMATION THE ORGANIZATION OR WEBSITE MAY PROVIDE OR RECOMMENDATIONS IT MAY MAKE. FURTHER, READERS SHOULD BE AWARE THAT INTERNET WEBSITES LISTED IN THIS WORK MAY HAVE CHANGED OR DISAPPEARED BETWEEN WHEN THIS WORK WAS WRITTEN AND WHEN IT IS READ.
For general information on our other products and services, please contact our Customer Care Department within the U.S. at 877-762-2974, outside the U.S. at 317-572-3993, or fax 317-572-4002.
For technical support, please visit www.wiley.com/techsupport.
Wiley also publishes its books in a variety of electronic formats and by print-on-demand. Some content that appears in standard print versions of this book may not be available in other formats. For more information about Wiley products, visit us at www.wiley.com.
Library of Congress Control Number: 2011936924
ISBN 978-1-118-03762-1 (pbk); ISBN 978-1-118-16387-0 (ebk); ISBN 978-1-118-16388-7 (ebk); ISBN 978-1-118-16389-4 (ebk)
Manufactured in the United States of America
10 9 8 7 6 5 4 3 2 1
About the Author
Michael Griffis is an author, trader, speaker, and business owner. His MBA from Crummer Graduate School of Business at Rollins College was the first step down his multi-faceted career path.
The MBA program emphasized economics, forecasting, and marketing. Its case-study style forced him to write more in a single semester than he had written in his entire Computer Sciences undergraduate program at the University of Florida. (As you may know, coders aren’t normally noted for their English composition skills.) Mike’s experience in the MBA program was his first hint that he enjoyed writing and was at least competent if not inspired.
Mike first became an active trader — for his own account — in the mid-1980s. He later became a stock broker who helped businesses and individuals manage employee and personal investments. Today he is again trading for his own account.
Mike has business interests in two marketing agencies that help clients address traditional and Internet marketing challenges. Through these agencies, he’s able to incorporate his economic knowledge and skills with economic indicators to help clients fine-tune their marketing forecasts. He first began writing about stocks online when the Internet was new and shiny. You can now find him at www.mikegriffis.com.
Dedication
This book would never have been without the love, support, and assistance of my wife Susan. I’m also deeply indebted to Zeki and Harley, the feline duo whose endless fascination with all things laptop led to endless comic relief.
Author’s Acknowledgments
I would like to express my gratitude to my editors at John Wiley & Sons, Inc., including acquisitions editor Michael Lewis, project editor Chad Sievers, copy editor Amanda Langferman, and technical editor Steve Russell, who made this book possible and made me sound like a better writer than I really am. Although I couldn’t have done it without their help and oversight, any errors or oversights are my responsibility alone.
Publisher’s Acknowledgments
We’re proud of this book; please send us your comments at http://dummies.custhelp.com. For other comments, please contact our Customer Care Department within the U.S. at 877-762-2974, outside the U.S. at 317-572-3993, or fax 317-572-4002.
Some of the people who helped bring this book to market include the following:
Acquisitions, Editorial, and Vertical Websites
Senior Project Editor: Chad R. Sievers
Acquisitions Editor: Michael Lewis
Copy Editor: Amanda M. Langferman
Assistant Editor: David Lutton
Editorial Program Coordinator: Joe Niesen
Technical Editor: Steven Russell, PhD
Editorial Manager: Michelle Hacker
Editorial Assistant: Rachelle Amick
Art Coordinator: Alicia B. South
Cover Photos: © iStockphoto.com / Lebazele
Cartoons: Rich Tennant (www.the5thwave.com)
Composition Services
Senior Project Coordinator: Kristie Rees
Layout and Graphics: Claudia Bell, Samantha Cherolis
Proofreaders: John Greenough, Jessica Kramer, Bonnie Mikkelson
Indexer: Valerie Haynes Perry
Special Help: Heike Baird, Christine Pingleton, Jessica Smith
Publishing and Editorial for Consumer Dummies
Kathleen Nebenhaus, Vice President and Executive Publisher
Kristin Ferguson-Wagstaffe, Product Development Director
Ensley Eikenburg, Associate Publisher, Travel
Kelly Regan, Editorial Director, Travel
Publishing for Technology Dummies
Andy Cummings, Vice President and Publisher
Composition Services
Debbie Stailey, Director of Composition Services
Introduction
Economics is one of those subjects that students either get instantly or seem to struggle with forever. Fortunately, the subject of economic indicators doesn’t share this stigma.
This book is written for people who have no intention of becoming economics experts. Rather, it’s for investors, business leaders, business managers, business leader wannabes, and the rest of you who are looking to improve your business plans and investment strategies with the help of the economic indicators you see and read about on a regular basis in the news. This book provides everything you need to know to determine the current economic situation and maybe even forecast the economic future.
Many people have misconceptions about economic indicators. Economic Indicators For Dummies is here to dispel those misconceptions and make your analysis easier. In doing so, this book uses plain terms and avoids economic jargon whenever possible. It covers all the background knowledge you need to know and shows you how to put economic indicators to use right away for your investment and business planning.
About This Book
This book presents economic indicators in a logical order, progressing from general, high-impact indicators to more specialized economic tools. The discussion for each indicator tells you what it is, what it means, and how you can use the information it provides. But before diving into specific indicators, this book starts with a brief introduction of the specialized terminology you need to know and a review of the basic analytic concepts used to create economic indicators.
You don’t have to read this book from cover to cover. Each chapter is intended to stand on its own. Feel free to jump to the sections that interest you most. Plan to use this book as a reference as you begin to use economic indicators in your business and investment plans.
Conventions Used in This Book
I’ve used some standard conventions throughout this book to help you understand concepts a bit better. Here’s what you need to know:
I use italic to highlight key terms and to add emphasis to certain words or points. (Don’t panic! I provide definitions for all key terms right after I first use them.)
I use boldface to point out keywords in bulleted lists and the action part of numbered lists.
I use monofont to make web addresses stand out. If you see an address that has broken across two lines, just type in what you see. I haven’t added any hyphens or other punctuation.
Sometimes, when the web address is unusually long, I use a special shortened address from bit.ly in place of the official address. The bit.ly address still takes you where you want to go; it’s just easier to type in.
Furthermore, the Internet is the easiest way to stay up-to-date with most of the indicators discussed in this book. So I provide a reference table, like the one shown in Table 1-1, for each indicator and an explanation to follow. That way, you know how to stay up-to-date with every indicator I discuss in this book.
Release schedule: The frequency of the indicator’s publication — weekly, monthly, or quarterly. If the release happens on the same day of the month, I list it here. For those indicators that are released on an inconsistent schedule, I describe the release schedule in the text.
Agency: The organization responsible for the indicator. If the source is an agency within a department of the U.S. Government, I list both the agency and the department. If the source is a private organization, I list just the organization’s name.
Web address: The URL of the economic indicator. The address you see in this column is either the full address or the shortened bit.ly address.
Sensitivity: A ranking that attempts to anticipate how investment markets generally react to the indicator’s release. Please be aware that investment market reactions depend on many circumstances. When an indicator reports a surprising result far outside of its expected range, investment markets are likely to react regardless of that indicator’s general sensitivity ranking. The three rankings I use in this book are
• High: Investors and traders pay close attention to highly sensitive indicators. Unexpected results almost always result in strong market reactions.
• Moderate: Investors and traders pay attention to moderate indicators. Unexpected results occasionally result in strong market reactions.
• Low: Few investors or traders pay close attention to low-ranked indicators. Although unexpected or surprising results rarely occur, when they do, market reaction may be strong. In this book, I include only those low-sensitivity indicators that provide information that you can’t find elsewhere.
Note that I don’t include a Sensitivity column in the data tables for international indicators (see Chapters 17 and 18). These indicators have little impact on markets outside the country.
Foolish Assumptions
As I wrote this book, I made a number of assumptions about your basic knowledge of general business concepts and investment markets. Most employees, employers, business leaders, and even business students have the basic background necessary to understand the business concepts I discuss in this book. Although I assume that you’re familiar with the business world, including how products are bought and sold, I don’t assume that you have any specific business or economics expertise.
I also assume that you have a basic understanding of investing, including stock and bond investments or mutual fund investing. If you’re familiar with your company’s 401(k) retirement plan, you should have enough background knowledge to dig into this book.
Finally, I assume that you know how to operate a computer and use the Internet. Most of the resources discussed in this book are available online, so you need access to the Internet to take advantage of the information you find in this book.
What Not to Read
Digging into the world of economic indicators leads to lots of information that’s surprising, unusual, or just plain odd. Few of these extraneous tidbits are crucial to your understanding of economic indicators, but I include some of them anyway because they’re fun. Feel free to use them to liven up your next dinner party. You can find this fascinating but ultimately superfluous information in sidebars, which you can identify by its black border and light-gray background. Also, I’ve flagged some highly technical information with a Technical Stuff icon. Generally, this level of detail is useful but not crucial for your understanding or for using the indicator.
How the Book Is Organized
To make this book as user friendly as possible, I break it down into six logical parts. The six parts are as follows:
Part I: Figuring Out the Economy
Although you don’t need a background in economics to use this book, you may want to review the basic concepts, like economic recession and growth, before you jump into the discussion on indicators. This part offers a refresher on the terminology you encounter in this book and defines some of the most common economic jargon in noneconomic terms. (You can also refer to the glossary at the end of this book for a refresher on economic terms.) In addition, it provides an overview of the analytic concepts and math you need to understand to get the most out of the economic indicators you follow. Don’t worry; this isn’t high-level math. If you can use a calculator or a spreadsheet, you’ll be fine. Lastly, this part includes a quick review of stocks, bonds and other investment markets.
Part II: Making Money, Spending Money: Employment and Consumer Indicators
Consumer spending is the driving force behind the U.S. economy. Knowing how much money consumers have to spend, seeing where that money comes from, and discovering how much consumers are actually spending provide the basis for understanding how the economy works. You also need to know how many people are working and how many are looking for jobs. After all, people who don’t have jobs likely don’t have money to spend, and a lack of spending definitely impacts the economy. You also need to know what people are buying because some purchases are more sensitive to the economy than others. In addition, you may want to know how consumers are feeling about their financials because customers buy more when they’re feeling optimistic.
Part III: The Essence of Business: Product and Service Indicators
Not too long ago, the U.S. economy was based on its manufacturing strength. Although the economy still has a large and robust manufacturing sector, the service sector has grown much larger. Identifying the kinds of products and services being produced in the United States provides another way to look at the economy. Tracking the largest economic sectors — including healthcare, automobile manufacturing, and housing — is an excellent way to determine the economy’s current health.
Part IV: Inflation, Productivity, Interest Rates, and Commodities: Oh My!
Many things can send the economy off its growth track. Inflation, rising employee compensation costs, and falling productivity can all hamper economic growth. Of these, inflation is usually the most worrisome. It affects the price of everything, including food and energy costs, wages, and the cost of borrowing money. Monitoring the economy for signs of growing inflation or falling productivity can help you prepare should either ever occur.
Part V: International Intrigue: Indicators beyond the United States
The U.S. economy is the largest economy in the world, at least for now. However, it isn’t the only economy. Many foreign countries provide excellent economic indicators, and some even publish them in English. This part provides a brief overview of some worldwide economic indicators that you may want to watch.
Part VI: The Part of Tens
The final part of the book is a hallmark for the For Dummies series — the Part of Tens. In it, you find advice that helps you create your own personalized ten-step checklist for monitoring the U.S. economy to help you improve your business plans or your investment returns. You also find ten techniques for making your knowledge of economic indicators pay. At the end of the book, you find a glossary that defines some common economic terms.
Icons Used in This Book
For Dummies books use little pictures, called icons, to flag certain chunks of text. Here’s what these icons mean:
Watch for these little bull’s-eyes to get ideas for using your newfound knowledge of economic indicators to improve your business or investment planning.
If you see this icon, you know whatever text appears next to it is particularly important for you to remember. Don’t skip it!
This icon highlights information that delves deeper into a particular topic. You may find the technical stuff to be interesting, but it isn’t crucial to your understanding of the concept being discussed.
Although the world of economic indicators isn’t fraught with danger, sometimes a misinterpretation can lead to a costly mistake. You don’t find many warnings in this book, but when you see one, look out!
Where to Go from Here
You’re ready to enter the exciting world of economic indicators. You can start anywhere in this book because each chapter is self-contained. But if you’re totally new to economics and economic indicators, starting with Chapter 1 is the best way for you to understand the basics. If you already know the basics, have a good understanding of math, and have a firm grounding in analytical concepts, then jump right in to Parts II through VI. Have fun and enjoy your trip into the fascinating world of economic indicators.
Part I
Figuring Out the Economy
In this part . . .
If you’re looking for a quick refresher on economics and wondering why you should want to follow economic indicators, you’ve come to the right place. Here you can explore concepts like economic growth and recession, the business cycle, and the relationship between investment markets and the economy. You also find explanations for the analytic concepts you need to know and definitions for some of the jargon used in economic indicators. In addition, this part introduces you to several different kinds of indicators and explains how they’re used.
Chapter 1
Introducing Economic Indicators
In This Chapter
Defining economic indicators
Looking at what the indicators tell you about the economy
Figuring out how to track and use indicators to meet your needs
Everyone has a financial interest in the economy. Although you may not think about it every day, your country’s economic system has a direct impact on your financial well-being. After all, the economy is made up of you, me, and all the people who buy products and services; the companies that create those products and services and deliver them to their consumers; the factories and equipment used to make the products; the facilities needed to offer the services; and of course, the government.
Lesen Sie weiter in der vollständigen Ausgabe!
Lesen Sie weiter in der vollständigen Ausgabe!
Lesen Sie weiter in der vollständigen Ausgabe!
Lesen Sie weiter in der vollständigen Ausgabe!
Lesen Sie weiter in der vollständigen Ausgabe!
Lesen Sie weiter in der vollständigen Ausgabe!
Lesen Sie weiter in der vollständigen Ausgabe!
Lesen Sie weiter in der vollständigen Ausgabe!
Lesen Sie weiter in der vollständigen Ausgabe!
Lesen Sie weiter in der vollständigen Ausgabe!
Lesen Sie weiter in der vollständigen Ausgabe!
Lesen Sie weiter in der vollständigen Ausgabe!
Lesen Sie weiter in der vollständigen Ausgabe!
Lesen Sie weiter in der vollständigen Ausgabe!
Lesen Sie weiter in der vollständigen Ausgabe!
Lesen Sie weiter in der vollständigen Ausgabe!
Lesen Sie weiter in der vollständigen Ausgabe!
Lesen Sie weiter in der vollständigen Ausgabe!
Lesen Sie weiter in der vollständigen Ausgabe!
Lesen Sie weiter in der vollständigen Ausgabe!
Lesen Sie weiter in der vollständigen Ausgabe!
Lesen Sie weiter in der vollständigen Ausgabe!
Lesen Sie weiter in der vollständigen Ausgabe!
Lesen Sie weiter in der vollständigen Ausgabe!
Lesen Sie weiter in der vollständigen Ausgabe!
Lesen Sie weiter in der vollständigen Ausgabe!


