32,99 €
Mehr erfahren.
- Herausgeber: John Wiley & Sons
- Kategorie: Wissenschaft und neue Technologien
- Serie: Mr. Spreadsheet's Bookshelf
- Sprache: Englisch
Take your Excel formulas to the next level with this updated reference John Walkenbach's name is synonymous with excellence in computer books that decipher complex technical topics. Known as "Mr. Spreadsheet," Walkenbach provides you with clear explanations on all the methods you can use to maximize the power of Excel with formulas within the frameworks of all the new features of Excel 2010. You'll learn how to create financial formulas, maximize the power of array formulas, develop custom worksheet functions with VBA, debug formulas, and much more. This invaluable reference is fully updated for the new Microsoft Office release and provides comprehensive formulas coverage, delivering more than 800 pages of Excel tips, tricks, and techniques you won't find anywhere else. * Demonstrates how to use all the new features of Excel 2010 to maximize your formulas * Shows how to develop custom worksheet functions with VBA, debug formulas, create financial formulas, and more * Serves as an indispensable reference no matter your skill level * Includes a valuable CD-ROM with sample files, templates and worksheets from the book, plus John Walkenbach's award-winning Power Utility Pak Prepare to excel with Excel when you have John Walkenbach and Excel 2010 Formulas by your side! Note: CD-ROM/DVD and other supplementary materials are not included as part of eBook file.
Sie lesen das E-Book in den Legimi-Apps auf:
Seitenzahl: 963
Veröffentlichungsjahr: 2010
Ähnliche


Excel® 2010 Formulas
Table of Contents
Introduction
What You Need to Know
What You Need to Have
Conventions in This Book
Keyboard conventions
Mouse conventions
What the icons mean
How This Book Is Organized
Part I: Basic Information
Part II: Using Functions in Your Formulas
Part III: Financial Formulas
Part IV: Array Formulas
Part V: Miscellaneous Formula Techniques
Part VI: Developing Custom Worksheet Functions
Part VII: Appendixes
How to Use This Book
About the Companion CD-ROM
About the Power Utility Pak Offer
Reach Out
Part I: Basic Information
Chapter 1: Excel in a Nutshell
The History of Excel
It started with VisiCalc
Then came Lotus
Microsoft enters the picture
Excel versions
The Object Model Concept
The Workings of Workbooks
Worksheets
Chart sheets
Macro sheets and dialog sheets
The Excel User Interface
A new UI
The Ribbon
Backstage View
Shortcut menus and the Mini Toolbar
Customizing the UI
Smart Tags
Task pane
Drag and drop
Keyboard shortcuts
Customized on-screen display
Data entry
Object and cell selecting
The Excel Help System
Cell Formatting
Numeric formatting
Stylistic formatting
Tables
Worksheet Formulas and Functions
Objects on the Drawing Layer
Shapes
Illustrations
Linked picture objects
Controls
Charts
Sparkline graphics
Customizing Excel
Macros
Add-in programs
Internet Features
Analysis Tools
Database access
Outlines
Scenario management
Pivot tables
Auditing capabilities
Solver add-in
Protection Options
Protecting formulas from being overwritten
Protecting a workbook's structure
Password-protecting a workbook
Chapter 2: Basic Facts about Formulas
Entering and Editing Formulas
Formula elements
Entering a formula
Pasting names
Spaces and line breaks
Formula limits
Sample formulas
Editing formulas
Using Operators in Formulas
Reference operators
Sample formulas that use operators
Operator precedence
Nested parentheses
Calculating Formulas
Cell and Range References
Creating an absolute or a mixed reference
Referencing other sheets or workbooks
Making an Exact Copy of a Formula
Converting Formulas to Values
Hiding Formulas
Errors in Formulas
Dealing with Circular References
Goal Seeking
A goal seeking example
More about goal seeking
Chapter 3: Working with Names
What's in a Name?
A Name's Scope
Referencing names
Referencing names from another workbook
Conflicting names
The Name Manager
Creating names
Editing names
Deleting names
Shortcuts for Creating Cell and Range Names
The New Name dialog box
Creating names using the Name box
Creating names automatically
Naming entire rows and columns
Names created by Excel
Creating Multisheet Names
Working with Range and Cell Names
Creating a list of names
Using names in formulas
Using the intersection operators with names
Using the range operator with names
Referencing a single cell in a multicell named range
Applying names to existing formulas
Applying names automatically when creating a formula
Unapplying names
Names with errors
Viewing named ranges
Using names in charts
How Excel Maintains Cell and Range Names
Inserting a row or column
Deleting a row or column
Cutting and pasting
Potential Problems with Names
Name problems when copying sheets
Name problems when deleting sheets
The Secret to Understanding Names
Naming constants
Naming text constants
Using worksheet functions in named formulas
Using cell and range references in named formulas
Using named formulas with relative references
Advanced Techniques That Use Names
Using the INDIRECT function with a named range
Using the INDIRECT function to create a named range with a fixed address
Using arrays in named formulas
Creating a dynamic named formula
Part II: Using Functions in Your Formulas
Chapter 4: Introducing Worksheet Functions
What Is a Function?
Simplify your formulas
Perform otherwise impossible calculations
Speed up editing tasks
Provide decision-making capability
More about functions
Function Argument Types
Names as arguments
Full-column or full-row as arguments
Literal values as arguments
Expressions as arguments
Other functions as arguments
Arrays as arguments
Ways to Enter a Function into a Formula
Entering a function manually
Using the Function Library commands
Using the Insert Function dialog box
More tips for entering functions
Function Categories
Financial functions
Date and time functions
Math and trig functions
Statistical functions
Lookup and reference functions
Database functions
Text functions
Logical functions
Information functions
User-defined functions
Engineering functions
Cube functions
Compatibility functions
Other function categories
Chapter 5: Manipulating Text
A Few Words about Text
How many characters in a cell?
Numbers as text
Text Functions
Determining whether a cell contains text
Working with character codes
Determining whether two strings are identical
Joining two or more cells
Displaying formatted values as text
Displaying formatted currency values as text
Removing excess spaces and nonprinting characters
Counting characters in a string
Repeating a character or string
Creating a text histogram
Padding a number
Changing the case of text
Extracting characters from a string
Replacing text with other text
Finding and searching within a string
Searching and replacing within a string
Advanced Text Formulas
Counting specific characters in a cell
Counting the occurrences of a substring in a cell
Removing trailing minus signs
Expressing a number as an ordinal
Determining a column letter for a column number
Extracting a filename from a path specification
Extracting the first word of a string
Extracting the last word of a string
Extracting all but the first word of a string
Extracting first names, middle names, and last names
Removing titles from names
Counting the number of words in a cell
Chapter 6: Working with Dates and Times
How Excel Handles Dates and Times
Understanding date serial numbers
Entering dates
Understanding time serial numbers
Entering times
Formatting dates and times
Problems with dates
Date-Related Functions
Displaying the current date
Displaying any date
Generating a series of dates
Converting a non-date string to a date
Calculating the number of days between two dates
Calculating the number of work days between two dates
Offsetting a date using only work days
Calculating the number of years between two dates
Calculating a person's age
Determining the day of the year
Determining the day of the week
Determining the date of the most recent Sunday
Determining the first day of the week after a date
Determining the nth occurrence of a day of the week in a month
Counting the occurrences of a day of the week
Expressing a date as an ordinal number
Calculating dates of holidays
Determining the last day of a month
Determining whether a year is a leap year
Determining a date's quarter
Converting a year to roman numerals
Time-Related Functions
Displaying the current time
Displaying any time
Summing times that exceed 24 hours
Calculating the difference between two times
Converting from military time
Converting decimal hours, minutes, or seconds to a time
Adding hours, minutes, or seconds to a time
Converting between time zones
Rounding time values
Working with non–time-of-day values
Chapter 7: Counting and Summing Techniques
Counting and Summing Worksheet Cells
Counting or Summing Records in Databases and Pivot Tables
Basic Counting Formulas
Counting the total number of cells
Counting blank cells
Counting nonblank cells
Counting numeric cells
Counting nontext cells
Counting text cells
Counting logical values
Counting error values in a range
Advanced Counting Formulas
Counting cells with the COUNTIF function
Counting cells that meet multiple criteria
Counting the most frequently occurring entry
Counting the occurrences of specific text
Counting the number of unique values
Creating a frequency distribution
Summing Formulas
Summing all cells in a range
Computing a cumulative sum
Summing the “top n” values
Conditional Sums Using a Single Criterion
Summing only negative values
Summing values based on a different range
Summing values based on a text comparison
Summing values based on a date comparison
Conditional Sums Using Multiple Criteria
Using And criteria
Using Or criteria
Using And and Or criteria
Chapter 8: Using Lookup Functions
What Is a Lookup Formula?
Functions Relevant to Lookups
Basic Lookup Formulas
The VLOOKUP function
The HLOOKUP function
The LOOKUP function
Combining the MATCH and INDEX functions
Specialized Lookup Formulas
Looking up an exact value
Looking up a value to the left
Performing a case-sensitive lookup
Choosing among multiple lookup tables
Determining letter grades for test scores
Calculating a grade point average
Performing a two-way lookup
Performing a two-column lookup
Determining the address of a value within a range
Looking up a value by using the closest match
Looking up a value using linear interpolation
Chapter 9: Tables and Worksheet Databases
Tables and Terminology
A worksheet database example
A table example
Uses for worksheet databases and tables
Working with Tables
Creating a table
Changing the look of a table
Navigating and selecting in a table
Adding new rows or columns
Deleting rows or columns
Moving a table
Setting table style options
Removing duplicate rows from a table
Sorting and filtering a table
Working with the Total row
Using formulas within a table
Referencing data in a table
Converting a table to a worksheet database
Using Advanced Filtering
Setting up a criteria range
Applying an advanced filter
Clearing an advanced filter
Specifying Advanced Filter Criteria
Specifying a single criterion
Specifying multiple criteria
Specifying computed criteria
Using Database Functions
Inserting Subtotals
Chapter 10: Miscellaneous Calculations
Unit Conversions
Solving Right Triangles
Area, Surface, Circumference, and Volume Calculations
Calculating the area and perimeter of a square
Calculating the area and perimeter of a rectangle
Calculating the area and perimeter of a circle
Calculating the area of a trapezoid
Calculating the area of a triangle
Calculating the surface and volume of a sphere
Calculating the surface and volume of a cube
Calculating the surface and volume of a cone
Calculating the volume of a cylinder
Calculating the volume of a pyramid
Solving Simultaneous Equations
Rounding Numbers
Basic rounding formulas
Rounding to the nearest multiple
Rounding currency values
Working with fractional dollars
Using the INT and TRUNC functions
Rounding to an even or odd integer
Rounding to n significant digits
Part III: Financial Formulas
Chapter 11: Borrowing and Investing Formulas
Financial Concepts
Time value of money
Cash in and cash out
Matching time periods
Timing of the first payment
The Basic Excel Financial Functions
Calculating present value
Calculating future value
Calculating payments
Calculating rates
Calculating periods
Calculating the Interest and Principal Components
Using the IPMT and PPMT functions
Using the CUMIPMT and CUMPRINC functions
Converting Interest Rates
Methods of quoting interest rates
Conversion formulas
Limitations of Excel's Financial Functions
Deferred start to a series of regular payments
Valuing a series of variable payments
Bond Calculations
Pricing bonds
Calculating yield
Chapter 12: Discounting and Depreciation Formulas
Using the NPV Function
Definition of NPV
NPV function examples
Using the NPV function to calculate accumulated amounts
Using the IRR Function
Rate of return
Geometric growth rates
Checking results
Multiple Rates of IRR and the MIRR Function
Multiple IRRs
Separating flows
Using balances instead of flows
Irregular Cash Flows
Net present value
Internal rate of return
Using the FVSCHEDULE Function
Calculating an annual return
Depreciation Calculations
Chapter 13: Financial Schedules
Creating Financial Schedules
Creating Amortization Schedules
A simple amortization schedule
A dynamic amortization schedule
Using payment and interest tables
Credit card calculations
Summarizing Loan Options Using a Data Table
Creating a one-way data table
Creating a two-way data table
Financial Statements and Ratios
Basic financial statements
Ratio analysis
Creating Indices
Part IV: Array Formulas
Chapter 14: Introducing Arrays
Introducing Array Formulas
A multicell array formula
A single-cell array formula
Creating an array constant
Array constant elements
Understanding the Dimensions of an Array
One-dimensional horizontal arrays
One-dimensional vertical arrays
Two-dimensional arrays
Naming Array Constants
Working with Array Formulas
Entering an array formula
Selecting an array formula range
Editing an array formula
Expanding or contracting a multicell array formula
Using Multicell Array Formulas
Creating an array from values in a range
Creating an array constant from values in a range
Performing operations on an array
Using functions with an array
Transposing an array
Generating an array of consecutive integers
Using Single-Cell Array Formulas
Counting characters in a range
Summing the three smallest values in a range
Counting text cells in a range
Eliminating intermediate formulas
Using an array in lieu of a range reference
Chapter 15: Performing Magic with Array Formulas
Working with Single-Cell Array Formulas
Summing a range that contains errors
Counting the number of error values in a range
Summing the n largest values in a range
Computing an average that excludes zeros
Determining whether a particular value appears in a range
Counting the number of differences in two ranges
Returning the location of the maximum value in a range
Finding the row of a value's nth occurrence in a range
Returning the longest text in a range
Determining whether a range contains valid values
Summing the digits of an integer
Summing rounded values
Summing every nth value in a range
Removing nonnumeric characters from a string
Determining the closest value in a range
Returning the last value in a column
Returning the last value in a row
Ranking data with an array formula
Working with Multicell Array Formulas
Returning only positive values from a range
Returning nonblank cells from a range
Reversing the order of cells in a range
Sorting a range of values dynamically
Returning a list of unique items in a range
Displaying a calendar in a range
Part V: Miscellaneous Formula Techniques
Chapter 16: Intentional Circular References
What Are Circular References?
Correcting an accidental circular reference
Understanding indirect circular references
Intentional Circular References
How Excel Determines Calculation and Iteration Settings
Circular Reference Examples
Generating unique random integers
Solving a recursive equation
Solving simultaneous equations using a circular reference
Animating a chart using iteration
Potential Problems with Intentional Circular References
Chapter 17: Charting Techniques
Understanding the SERIES Formula
Using names in a SERIES formula
Unlinking a chart series from its data range
Creating Links to Cells
Adding a chart title link
Adding axis title links
Adding links to data labels
Adding text links
Adding a linked picture to a chart
Chart Examples
Charting progress toward a goal
Creating a gauge chart
Displaying conditional colors in a column chart
Creating a comparative histogram
Creating a Gantt chart
Creating a box plot
Plotting every nth data point
Plotting the last n data points
Selecting a series from a combo box
Plotting mathematical functions
Plotting a circle
Creating a clock chart
Creating awesome designs
Working with Trendlines
Linear trendlines
Working with nonlinear trendlines
Chapter 18: Pivot Tables
About Pivot Tables
A Pivot Table Example
Data Appropriate for a Pivot Table
Creating a Pivot Table
Specifying the Data
Specifying the location for the pivot table
Laying out the pivot table
Formatting the pivot table
Modifying the pivot table
More Pivot Table Examples
Question 1
Question 2
Question 3
Question 4
Question 5
Question 6
Question 7
Grouping Pivot Table Items
A manual grouping example
Viewing grouped data
Automatic grouping examples
Creating a Frequency Distribution
Creating a Calculated Field or Calculated Item
Creating a calculated field
Inserting a calculated item
Filtering Pivot Tables with Slicers
Referencing Cells within a Pivot Table
Another Pivot Table Example
Producing a Report with a Pivot Table
Chapter 19: Conditional Formatting and Data Validation
Conditional Formatting
Specifying conditional formatting
Conditional formats that use graphics
Working with conditional formats
Creating formula-based rules
Data Validation
Specifying validation criteria
Types of validation criteria you can apply
Creating a drop-down list
Using formulas for data validation rules
Creating a dependent list
Chapter 20: Creating Megaformulas
What Is a Megaformula?
Creating a Megaformula: A Simple Example
Megaformula Examples
Using a megaformula to remove middle names
Using a megaformula to return a string's last space character position
Using a megaformula to determine the validity of a credit card number
Generating random names
The Pros and Cons of Megaformulas
Chapter 21: Tools and Methods for Debugging Formulas
Formula Debugging?
Formula Problems and Solutions
Mismatched parentheses
Cells are filled with hash marks
Blank cells are not blank
Extra space characters
Formulas returning an error
Absolute/relative reference problems
Operator precedence problems
Formulas are not calculated
Actual versus displayed values
Floating-point number errors
Phantom link errors
Logical value errors
Circular reference errors
Excel's Auditing Tools
Identifying cells of a particular type
Viewing formulas
Tracing cell relationships
Tracing error values
Fixing circular reference errors
Using background error checking
Using Excel's Formula Evaluator
Part VI: Developing Custom Worksheet Functions
Chapter 22: Introducing VBA
About VBA
Displaying the Developer Tab
About Macro Security
Saving Workbooks That Contain Macros
Introducing the Visual Basic Editor
Activating the VB Editor
The VB Editor components
Using the Project window
Using code windows
Entering VBA code
Saving your project
Chapter 23: Function Procedure Basics
Why Create Custom Functions?
An Introductory VBA Function Example
About Function Procedures
Declaring a function
Choosing a name for your function
Using functions in formulas
Using function arguments
Using the Insert Function Dialog Box
Adding a function description
Specifying a function category
Adding argument descriptions
Testing and Debugging Your Functions
Using the VBA MsgBox statement
Using Debug.Print statements in your code
Calling the function from a Sub procedure
Setting a breakpoint in the function
Creating Add-Ins
Chapter 24: VBA Programming Concepts
An Introductory Example Function Procedure
Using Comments in Your Code
Using Variables, Data Types, and Constants
Defining data types
Declaring variables
Using constants
Using strings
Using dates
Using Assignment Expressions
Using Arrays
Declaring an array
Declaring multidimensional arrays
Using Built-In VBA Functions
Controlling Execution
The If-Then construct
The Select Case construct
Looping blocks of instructions
The On Error statement
Using Ranges
The For Each-Next construct
Referencing a range
Some useful properties of ranges
The Set keyword
The Intersect function
The Union function
The UsedRange property
Chapter 25: VBA Custom Function Examples
Simple Functions
Does a cell contain a formula?
Returning a cell's formula
Is the cell hidden?
Returning a worksheet name
Returning a workbook name
Returning the application's name
Returning Excel's version number
Returning cell formatting information
Determining a Cell's Data Type
A Multifunctional Function
Generating Random Numbers
Generating random numbers that don't change
Selecting a cell at random
Calculating Sales Commissions
A function for a simple commission structure
A function for a more complex commission structure
Text Manipulation Functions
Reversing a string
Scrambling text
Returning an acronym
Does the text match a pattern?
Does a cell contain a particular word
Does a cell contain text?
Extracting the nth Element from a String
Spelling out a number
Counting Functions
Counting pattern-matched cells
Counting sheets in a workbook
Counting words in a range
Counting colors
Date Functions
Calculating the next Monday
Calculating the next day of the week
Which week of the month?
Working with dates before 1900
Returning the Last Nonempty Cell in a Column or Row
The LASTINCOLUMN function
The LASTINROW function
Multisheet Functions
Returning the maximum value across all worksheets
The SHEETOFFSET function
Advanced Function Techniques
Returning an error value
Returning an array from a function
Returning an array of nonduplicated random integers
Randomizing a range
Using optional arguments
Using an indefinite number of arguments
Part VII: Appendixes
Appendix A: Excel Function Reference
Appendix B: Using Custom Number Formats
Automatic number formatting
Formatting numbers by using the Ribbon
Using shortcut keys to format numbers
Using the Format Cells dialog box to format numbers
Parts of a number format string
Custom number format codes
Scaling values
Hiding zeros
Displaying leading zeros
Displaying fractions
Displaying N/A for text
Displaying text in quotes
Repeating a cell entry
Displaying a negative sign on the right
Conditional number formatting
Coloring values
Formatting dates and times
Displaying text with numbers
Displaying a zero with dashes
Using special symbols
Suppressing certain types of entries
Filling a cell with a repeating character
Displaying leading dots
Appendix C: Additional Excel Resources
Support options
Microsoft Knowledge Base
Microsoft Excel home page
Microsoft Office home page
Accessing newsgroups by using a newsreader
Accessing newsgroups by using a Web browser
Searching newsgroups
The Spreadsheet Page
Daily Dose of Excel
Jon Peltier's Excel page
Pearson Software consulting
Contextures
David McRitchie's Excel pages
Pointy Haired Dilbert
Mr. Excel
Appendix D: What's on the CD-ROM?
eBook version of Excel 2010 Formulas
Examples files for Excel 2010 Formulas
Excel® 2010 Formulas
by John Walkenbach
Excel® 2010 Formulas
Published byWiley Publishing, Inc.111 River StreetHoboken, NJ 07030-5774www.wileycom
Copyright © 2010 by Wiley Publishing, Inc., Indianapolis, Indiana
Published by Wiley Publishing, Inc., Indianapolis, Indiana
Published simultaneously in Canada
No part of this publication may be reproduced, stored in a retrieval system or transmitted in any form or by any means, electronic, mechanical, photocopying, recording, scanning or otherwise, except as permitted under Sections 107 or 108 of the 1976 United States Copyright Act, without either the prior written permission of the Publisher, or authorization through payment of the appropriate per-copy fee to the Copyright Clearance Center, 222 Rosewood Drive, Danvers, MA 01923, (978) 750-8400, fax (978) 646-8600. Requests to the Publisher for permission should be addressed to the Permissions Department, John Wiley & Sons, Inc., 111 River Street, Hoboken, NJ 07030, (201) 748-6011, fax (201) 748-6008, or online at http://www.wileycom/permissions.
Trademarks: Wiley, the Wiley Publishing logo, For Dummies, the Dummies Man logo, A Reference for the Rest of Us!, The Dummies Way, Dummies Daily, The Fun and Easy Way, Dummies.com, Making Everything Easier, and related trade dress are trademarks or registered trademarks of John Wiley & Sons, Inc. and/or its affiliates in the United States and other countries, and may not be used without written permission. Excel is a registered trademark of Microsoft Corporation in the United States and/or other countries. All other trademarks are the property of their respective owners. Wiley Publishing, Inc., is not associated with any product or vendor mentioned in this book.
Limit of Liability/Disclaimer of Warranty: The publisher and the author make no representations or warranties with respect to the accuracy or completeness of the contents of this work and specifically disclaim all warranties, including without limitation warranties of fitness for a particular purpose. No warranty may be created or extended by sales or promotional materials. The advice and strategies contained herein may not be suitable for every situation. This work is sold with the understanding that the publisher is not engaged in rendering legal, accounting, or other professional services. If professional assistance is required, the services of a competent professional person should be sought. Neither the publisher nor the author shall be liable for damages arising herefrom. The fact that an organization or Website is referred to in this work as a citation and/or a potential source of further information does not mean that the author or the publisher endorses the information the organization or Website may provide or recommendations it may make. Further, readers should be aware that Internet Websites listed in this work may have changed or disappeared between when this work was written and when it is read. FULFILLMENT OF EACH COUPON OFFER IS THE SOLE RESPONSIBILITY OF THE OFFEROR.
For general information on our other products and services, please contact our Customer Care Department within the U.S. at 877-762-2974, outside the U.S. at 317-572-3993, or fax 317-572-4002.
For technical support, please visit www.wileycom/techsupport.
Wiley also publishes its books in a variety of electronic formats. Some content that appears in print may not be available in electronic books.
Library of Congress Control Number: 2010925706
ISBN: 978-0-470-47536-2
Manufactured in the United States of America
10 9 8 7 6 5 4 3 2 1
About the Author
John Walkenbach is a leading authority on spreadsheet software, and principal of J-Walk and Associates Inc., a one-person consulting firm based in southern Arizona. John has received a Microsoft MVP award every year since 2000. He's the author of more than 50 spreadsheet books, and has written more than 300 articles and reviews for a variety of publications, including PC World, InfoWorld, PC Magazine, Windows, and PC/Computing. John also maintains a popular Web site (The Spreadsheet Page, http://spreadsheetpagecom), and is the developer of several Excel utilities, including the Power Utility Pak, an award-winning add-in for Excel. John graduated from the University of Missouri, and earned a Masters and PhD from the University of Montana.
Publisher's Acknowledgments
We're proud of this book; please send us your comments at http://dummiescusthelpcom. For other comments, please contact our Customer Care Department within the U.S. at 877-762-2974, outside the U.S. at 317-572-3993, or fax 317-572-4002.
Some of the people who helped bring this book to market include the following:
Acquisitions, Editorial, and Media Development
Project Editor: Susan B. Cohen
Acquisitions Editor: Katie Mohr
Copy Editor: Susan B. Cohen
Technical Editor: Niek Otten
Editorial Manager: Jodi Jensen
Media Development Assistant Project Manager: Jenny Swisher
Media Development Associate Producer: Marilyn Hummel
Editorial Assistant: Amanda Graham
Sr. Editorial Assistant: Cherie Case
Composition Services
Project Coordinator: Katherine Crocker
Layout and Graphics: Beth Brooks, Jennifer Mayberry, Ronald G. Terry, Erin Zeltner
Proofreaders: Laura Albert, Laura L. Bowman
Indexer: Christine Karpeles
Publishing and Editorial for Technology Dummies
Richard Swadley, Vice President and Executive Group Publisher
Andy Cummings, Vice President and Publisher
Mary Bednarek, Executive Acquisitions Director
Mary C. Corder, Editorial Director
Publishing for Consumer Dummies
Diane Graves Steele, Vice President and Publisher
Composition Services
Debbie Stailey, Director of Composition Services
Part I: Basic Information
Chapter 1
Excel in a Nutshell
Chapter 2
Basic Facts about Formulas
Chapter 3
Working with Names
Chapter 1: Excel in a Nutshell
In This Chapter
• A brief history of Excel
• What's new in Excel 2010
• The object model concept in Excel
• The workings of workbooks
• The user interface
• The two types of cell formatting
• Worksheet formulas and functions
• Objects on the worksheet's invisible drawing layer
• Macros, toolbars, and add-ins for Excel customization
• Internet features
• Analysis tools
• Protection options
Microsoft Excel has been referred to as “the best application ever written for Windows.” You may or may not agree with that statement, but you can't deny that Excel is one of the oldest Windows products and has undergone many reincarnations and face-lifts over the years. Cosmetically, the current version — Excel 2010 — barely even resembles the original version. However, many of Excel's key elements have remained intact over the years, with significant enhancements, of course.
This chapter presents a concise overview of the features available in the more recent versions of Excel, with specific emphasis on Excel 2010. It sets the stage for the subsequent chapters and provides an overview for those who may have let their Excel skills get rusty.
The History of Excel
You probably weren't expecting a history lesson when you bought this book, but you may find this information interesting. At the very least, this section provides fodder for the next office trivia match.
Spreadsheets comprise a huge business, but most of us tend to take this software for granted. In the pre-spreadsheet days, people relied on clumsy mainframes or calculators and spent hours doing what now takes minutes.
It started with VisiCalc
Dan Bricklin and Bob Frankston conjured up VisiCalc, the world's first electronic spreadsheet, back in the late 1970s when personal computers were unheard of in the office environment. They wrote VisiCalc for the Apple II computer, an interesting machine that seems like a toy by today's standards. VisiCalc caught on quickly, and many forward-looking companies purchased the Apple II for the sole purpose of developing their budgets with VisiCalc. Consequently, VisiCalc is often credited for much of Apple II's initial success.
Then came Lotus
When the IBM PC arrived on the scene in 1982, thus legitimizing personal computers, VisiCorp wasted no time porting VisiCalc to this new hardware environment. Envious of VisiCalc's success, a small group of computer enthusiasts at a start-up company in Cambridge, Massachusetts, refined the spreadsheet concept. Headed by Mitch Kapor and Jonathan Sachs, the company designed a new product and launched the software industry's first full-fledged marketing blitz.
Released in January 1983, Lotus Development Corporation's 1-2-3 proved an instant success. Despite its $495 price tag (yes, people really paid that much for a single program), it quickly outsold VisiCalc and rocketed to the top of the sales charts, where it remained for many years.
Microsoft enters the picture
Most people don't realize that Microsoft's experience with spreadsheets extends back to the early 1980s. In 1982, Microsoft released its first spreadsheet — MultiPlan. Designed for computers running the CP/M operating system, the product was subsequently ported to several other platforms, including Apple II, Apple III, XENIX, and MS-DOS. MultiPlan essentially ignored existing software UI standards. Difficult to learn and use, it never earned much of a following in the United States. Not surprisingly, Lotus 1-2-3 pretty much left MultiPlan in the dust.
Excel partly evolved from MultiPlan, and first surfaced in 1985 on the Macintosh. Like all Mac applications, Excel was a graphics-based program (unlike the character-based MultiPlan). In November 1987, Microsoft released the first version of Excel for Windows (labeled Excel 2 to correspond with the Macintosh version). Excel didn't catch on right away, but as Windows gained popularity, so did Excel. Lotus eventually released a Windows version of Lotus 1-2-3, and Excel had additional competition from Quattro Pro — originally a DOS program developed by Borland International, then sold to Novell, and then sold again to Corel (its current owner).
Excel versions
Excel 2010 is actually Excel 14 in disguise. You may think that this name represents the 14th version of Excel. Think again. Microsoft may be a successful company, but its version-naming techniques can prove quite confusing. As you'll see, Excel 2010 actually represents the 11th Windows version of Excel. In the following sections, I briefly describe the major Windows versions of Excel.
Excel 2
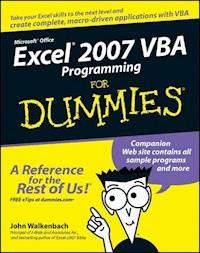
The original version of Excel for Windows, Excel 2 first appeared in late 1987. It was labeled Version 2 to correspond to the Macintosh version (the original Excel). Because Windows wasn't in widespread use at the time, this version included a runtime version of Windows — a special version with just enough features to run Excel and nothing else. This version appears quite crude by today's standards, as shown in Figure 1-1.
Figure 1-1: The original Excel 2 for Windows. Excel has come a long way since its original version.(Photo courtesy of Microsoft Corporation)
Excel 3
At the end of 1990, Microsoft released Excel 3 for Windows. This version offered a significant improvement in both appearance and features. It included toolbars, drawing capabilities, worksheet outlining, add-in support, 3-D charts, workgroup editing, and lots more.
Excel 4
Excel 4 hit the streets in the spring of 1992. This version made quite an impact on the marketplace as Windows increased in popularity. It boasted lots of new features and usability enhancements that made it easier for beginners to get up to speed quickly.
Excel 5
In early 1994, Excel 5 appeared on the scene. This version introduced tons of new features, including multisheet workbooks and the new Visual Basic for Applications (VBA) macro language. Like its predecessor, Excel 5 took top honors in just about every spreadsheet comparison published in the trade magazines.
Excel 95
Excel 95 (also known as Excel 7) shipped in the summer of 1995. On the surface, it resembled Excel 5 (this version included only a few major new features). However, Excel 95 proved to be significant because it presented the first version to use more advanced 32-bit code. Excel 95 and Excel 5 use the same file format.
Excel 97
Excel 97 (also known as Excel 8) probably offered the most significant upgrade ever. The toolbars and menus took on a great new look, online help moved a dramatic step forward, and the number of rows available in a worksheet quadrupled. And if you're a macro developer, you may have noticed that Excel's programming environment (VBA) moved up several notches on the scale. Excel 97 also introduced a new file format.
Excel 2000
Excel 2000 (also known as Excel 9) was released in June of 1999. Excel 2000 offered several minor enhancements, but the most significant advancement was the ability to use HTML as an alternative file format. Excel 2000 still supported the standard binary file format, of course, which is compatible with Excel 97.
Excel 2002
Excel 2002 (also known as Excel 10 or Excel XP) was released in June of 2001 and is part of Microsoft Office XP. This version offered several new features, most of which are fairly minor and were designed to appeal to novice users. Perhaps the most significant new feature was the capability to save your work when Excel crashes and also recover corrupt workbook files that you may have abandoned long ago. Excel 2002 also added background formula error checking and a new formula-debugging tool.
Excel 2003
Excel 2003 (also known as Excel 11) was released in the fall of 2003. This version had very few new features. Perhaps the most significant new feature was the ability to import and export XML files and map the data to specific cells in a worksheet. It also introduced the concept of the List, a specially designated range of cells. Both of these features would prove to be precursors to future enhancements.
Excel 2007
Excel 2007 (also known as Excel 12) was released in early 2007. Its official name is Microsoft Office Excel 2007. This release represented the most significant change since Excel 97, including a change to Excel's default file format. The new format was XML based although a binary format is still available. Another major change was the Ribbon, a new type of UI that replaced the Excel menu and toolbar system. In addition to these two major changes, Microsoft enhanced the List concept introduced in Excel 2003 (a List is now known as a Table), improved the look of charts, significantly increased the number of rows and columns, and added some new worksheet functions.
XML (Extensible Markup Language) stores data in a structured text format. The new file formats are actually compressed folders that contain several different XML files. The default format's file extension is .xlsx. There's also a macro-enabled format with the extension .xlsm, a new binary format with the extension .xlsb, and all the legacy formats that you're used to.
Excel 2010
The current version, Excel 2010, was released in early 2010 and is also known as Excel 14. If you think you've spotted a typo in the previous sentence, you're wrong. Yes, even big companies can be superstitious; Microsoft skipped Version 13 of Office and went from Version 12 to Version 14.
Excel 2010 builds on the improvements introduced in Excel 2007, and it offers several new enhancements. See the sidebar, “What's new in Excel 2010?”
The Object Model Concept
If you've dealt with computers for any length of time, you've undoubtedly heard the term object-oriented programming. An object essentially represents a software element that a programmer can manipulate. When using Excel, you may find it useful to think in terms of objects, even if you have no intention of becoming a programmer. An object-oriented approach can often help you keep the various elements in perspective.
Excel objects include the following:
• Excel itself
• An Excel workbook
• A worksheet in a workbook
• A range in a worksheet
• A button on a worksheet
• A ListBox control on a UserForm (a custom dialog box)
• A chart sheet
• A chart on a chart sheet
• A chart series in a chart
New Feature
What's new in Excel 2010?
Here's a quick summary of what's new, relative to Excel 2007:
• 64-bit version: If your hardware supports it, you can install the 64-bit version, which lets you create much larger workbooks.
• Sparkline charts: Create small, in-cell charts to summarize a range of data graphically.
• Pivot table Slicers: A new way to filter and display data in pivot tables.
• Pivot table formatting options: You have more control over the appearance of pivot table reports.
• File tab: The File tab replaces the Office button, which is located to the left of the other tabs. Clicking it displays Backstage View, a screen that lets you perform various operations on your workbook. This view essentially replaces the traditional File and Print menus — plus quite a bit more.
• Draft mode for charts: If you use many highly formatted charts, you can choose to display them in draft mode for improved performance.
• Conditional formatting enhancements: Data bar conditional formatting can display in a solid color, and the bars provide a more accurate display.
• Function enhancements: Many of Excel's statistical functions have been improved in terms of numeric accuracy. The old versions of these functions are still available and have been relegated to a new function category called Compatibility.
• Image editing enhancements: You have much more control over the appearance of graphic images inserted into a workbook.
• Paste preview: When you copy a range, the Paste command displays various options (with preview).
• Ribbon customization: End users can customize the Ribbon by adding new tabs and groups.
• Equation editor: Create and display (noncalculating) mathematical equations.
• Faster processing: Microsoft made some improvements to the calculation engine, and files load a bit faster.
• New security features: Workbooks downloaded from the Internet or from e-mail attachments are opened in Protected View mode. Workbooks can be designated as “trusted,” and they don't need to reside in special trusted folders.
• UpdatedSolver: Excel 2010 includes a new version of the Solver add-in.
• Enhancements to VBA: Many operations that used to require old XLM macros can now be performed directly using VBA macro commands.
Notice the existence of an object hierarchy: The Excel object contains workbook objects, which contain worksheet objects, which contain range objects. This hierarchy is called Excel's object model. Other Microsoft Office products have their own object model. The object model concept proves to be vitally important when developing VBA macros. Even if you don't create macros, you may find it helpful to think in terms of objects.
The Workings of Workbooks
The core document of Excel is a workbook. Everything that you do in Excel takes place in a workbook.
Beginning with Excel 2007, workbook “files” are actually compressed folders. You may be familiar with compressed folders if you've ever used a file with a .zip extension. Inside the compressed folders are a number of files that hold all the information about your workbook, including charts, macros, formatting, and the data in its cells.
An Excel workbook can hold any number of sheets (limited only by memory). The four types of sheets are
• Worksheets
• Chart sheets
• MS Excel 4.0 macro sheets (obsolete, but still supported)
• MS Excel 5.0 dialog sheets (obsolete, but still supported)
You can open or create as many workbooks as you want (each in its own window), but only one workbook is the active workbook at any given time. Similarly, only one sheet in a workbook is the active sheet. To activate a different sheet, click its corresponding tab at the bottom of the window, or press Ctrl+PgUp (for the previous sheet) or Ctrl+PgDn (for the next sheet). To change a sheet's name, double-click its Sheet tab and type the new text for the name. Right-clicking a tab brings up a shortcut menu with some additional sheet-manipulation options.
You can also hide the window that contains a workbook by using the View⇒Window⇒Hide command. A hidden workbook window remains open but not visible. Use the View⇒Window⇒Unhide command to make the window visible again. A single workbook can display in multiple windows (choose View⇒Window⇒New Window). Each window can display a different sheet or a different area of the same sheet.
Worksheets
The most common type of sheet is a worksheet — which you normally think of when you think of a spreadsheet. Excel 2010 worksheets have 16,384 columns and 1,048,576 rows.
Versions prior to Excel 2007 support only 256 columns and 65,536 rows. If you open such a file, Excel 2010 enters compatibility mode to work with the smaller worksheet grid. In order to work with the larger grid, you must save the file in one of the Excel 2010 formats. Then close the workbook and reopen it.
How big is a worksheet?
It's interesting to stop and think about the actual size of a worksheet. Do the arithmetic (16,384 × 1,048,576), and you'll see that a worksheet has 17,179,869,184 cells. Remember that this is in just one worksheet. A single workbook can hold more than one worksheet.
If you're using a 1600 x 1200 video mode with the default row heights and column widths, you can see 24 columns and 49 rows (or 1,176 cells) at a time — which is about .0000068 percent of the entire worksheet. In other words, more than 14.6 million screens of information reside within a single worksheet.
If you entered a single digit into each cell at the relatively rapid clip of one cell per second, it would take you over 500 years, nonstop, to fill up a worksheet. To print the results of your efforts would require more than 36 million sheets of paper — a stack about 12,000 feet high (that's ten Empire State Buildings stacked on top of each other).
Having access to more cells isn't the real value of using multiple worksheets in a workbook. Rather, multiple worksheets are valuable because they enable you to organize your work better. Back in the old days, when a spreadsheet file consisted of a single worksheet, developers wasted a lot of time trying to organize the worksheet to hold their information efficiently. Now, you can store information on any number of worksheets and still access it instantly.
You have complete control over the column widths and row heights, and you can even hide rows and columns (as well as entire worksheets). You can display the contents of a cell vertically (or at an angle) and even wrap around to occupy multiple lines. In addition, you can merge cells together to form a larger cell.
By default, every new workbook starts out with three worksheets. You can easily add a new sheet when necessary, so you really don't need to start with three sheets. You may want to change this default to a single sheet. To change this option, choose the File⇒Options command, click the General tab, and change the setting for the option labeled Include This Many Sheets.
Chart sheets
A chart sheet holds a single chart. Many users ignore chart sheets, preferring to use embedded charts, which are stored on the worksheet's drawing layer. Using chart sheets is optional, but they make it a bit easier to locate a particular chart, and they prove especially useful for presentations. I discuss embedded charts (or floating charts on a worksheet) later in this chapter.
Macro sheets and dialog sheets
This section discusses two obsolete Excel features that continue to be supported.
An Excel 4.0 macro sheet is a worksheet that has some different defaults. Its purpose is to hold XLM macros. XLM is the macro system used in Excel version 4.0 and earlier. This macro system was replaced by VBA in Excel 5.0 and is not discussed in this book.
An Excel 5.0 dialog sheet is a drawing grid that can hold text and controls. In Excel 5.0 and Excel 95, dialog sheets were used to make custom dialog boxes. UserForms were introduced in Excel 97 to replace these sheets.
The Excel User Interface
AUI is the means by which an end user communicates with a computer program. A UI includes elements such as menus, dialog boxes, toolbars, and keystroke combinations, as well as features such as drag and drop.
A new UI
Almost every Windows program you use employs the menu and toolbar approach. That is, at the top of the screen is a menu bar that contains virtually every command that's available in the application, and below that is one or more toolbars, which provide shortcuts to some of the more frequently used commands. With the release of Office 2007, the days of menus and toolbars are over.
The new UI for Excel consists of components like the Ribbon, Backstage View, the Mini Toolbar, and the Quick Access toolbar.
The Ribbon
The Ribbon is the primary UI component in Excel. It replaces the menu and most of the toolbars that were common in previous versions, and it is a very significant departure from the interfaces of most Windows-based applications.
One-stop shopping
Microsoft felt that the commands contained in the old menu and toolbar system were becoming so numerous that a new paradigm was necessary. One of the main goals for developing the Ribbon was to provide the user with a single place to look for a particular feature. Every commonly used command available in Excel would be contained in the Ribbon (or in a dialog box accessed via the Ribbon). Although Microsoft succeeded in putting most of the available commands on the Ribbon, it's still a pretty big place.
The Ribbon in Office 2007 received mixed reviews. Some people hated it, and others loved it. For some, the hatred was so severe that they sought Excel 2007 add-ins that restored the old menus. Others set up online petitions, asking Microsoft to restore the old menus for Office. Fact is, the Ribbon is here to stay. Once you get used to the Ribbon, it really is easier to use than the convoluted menu system that it replaced.
A few commands failed to make the cut and do not appear in the Ribbon. But they are still available if you know where to look for them. Right-click the Quick Access toolbar and choose Customize Quick Access Toolbar. Excel displays a dialog box with a list of commands that you can add to your Quick Access toolbar. Some of these commands aren't available elsewhere in the UI. In Excel 2010, you can also add new commands to the Ribbon: Right-click the Ribbon and select Customize The Ribbon.
Tabs, groups, and tools
The Ribbon is a band of tools that stretches across the top of the Excel window. About the vertical size of three of the old-style toolbars, the Ribbon sports a number of tabs including Home, Insert, Page Layout, and others. On each tab are groups that contain related tools. On the Home tab, for example, you find the Clipboard group, the Font group, the Alignment group, and others.
Within the groups are the tools, which are similar to the tools that existed on the old-style toolbars with one major difference: their different sizes. Tools that you use most often are larger than less-frequently used tools. For example, nearly half of the Clipboard group is consumed by the large Paste tool; the Cut, Copy, and Format Painter tools are much smaller. Microsoft determined that the Paste tool is the most used tool and thus sized it accordingly.
The Ribbon and all its components resize dynamically as you resize the Excel window horizontally. Smaller Excel windows collapse the tools on compressed tabs and groups, and maximized Excel windows on large monitors show everything that's available. Even in a small window, all Ribbon commands remain available. You just may need to click a few extra times to access them.
Figure 1-2 shows three sizes of the Ribbon when the Home tab is displayed using an increasingly smaller horizontal window size.
Figure 1-2: The Ribbon sizes dynamically, depending on the horizontal size of Excel's window.
Navigation
Using the Ribbon is fairly easy with a mouse. You click a tab and then click a tool. If you prefer to use the keyboard, Microsoft has added a feature just for you. Pressing Alt displays tiny squares with shortcut letters in them that hover over their respective tab or tool. Each shortcut letter that you press either executes its command or drills down to another level of shortcut letters. Pressing Esc cancels the letters or moves up to the previous level.
For example, a keystroke sequence of Alt+HBB adds a double border to the bottom of the selection. The Alt key activates the shortcut letters, the H shortcut activates the Home tab, the B shortcut activates the Borders tool menu, and the second B shortcut executes the Bottom Double Border command. Note that it's not necessary to keep the Alt key depressed while you press the other keys.
Contextual tabs


