9,99 €
Mehr erfahren.
- Herausgeber: 50Minutes.com
- Kategorie: Lebensstil
- Serie: Management & Marketing
- Sprache: Englisch
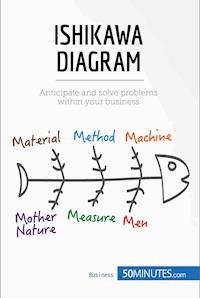
Anticipate and solve problems within your business
This book is a practical and accessible guide to understanding and implementing the Ishikawa diagram, providing you with the essential information and saving time.
In 50 minutes you will be able to:
• Recognize the benefits of using the Ishikawa diagram for problem-solving and project management
• Clearly identify the root causes of a problem through brainstorming session and categorizing them according to the 5 Ms
• Use your findings to devise a concrete plan of action to tackle the underlying cause of the problem
ABOUT 50MINUTES.COM | Management & Marketing
50MINUTES.COM provides the tools to quickly understand the main theories and concepts that shape the economic world of today. Our publications are easy to use and they will save you time. They provide elements of theory and case studies, making them excellent guides to understand key concepts in just a few minutes. In fact, they are the starting point to take action and push your business to the next level.
Das E-Book können Sie in Legimi-Apps oder einer beliebigen App lesen, die das folgende Format unterstützen:
Seitenzahl: 20
Veröffentlichungsjahr: 2015
Ähnliche


The Ishikawa diagram for risk management
Key information
Names: Ishikawa diagram, fishbone diagram, herringbone diagram, cause-and-effect diagram, Fishikawa, the 5 Ms.Uses: The Ishikawa diagram identifies the causes and effects of a problem. It can also be used as an analytical tool in project management (particularly in risk management) and quality control. Why is it successful? This tool prevents users from overlooking some of the causes of a problem and provides the necessary elements for the study of potential solutions. This diagram is considered to be a quality management tool.Key words:Approach: method; way of reasoning.Brainstorming: an original research technique based on free associations put forward by all the members of a group.Cause: the reason for something; the thing that causes or is responsible for it.Effect: result or consequence.Market share: the percentage of company sales in relation to the total sales in the sector.Problem: an issue or question that can be debated and requires a resolution.Solution: an answer to a problem or question.Introduction
History
The Ishikawa diagram was invented by Kaoru Ishikawa (1915-1989), a Japanese professor and chemical engineer at the University of Tokyo. A renowned expert and pioneer in the field of quality management theories, he used this diagram for the first time in 1943 to try to explain to a group of engineers in a steel company how to understand a problem based on an overall analysis – as exhaustive as possible – of complex factors.
Definition of the model
The Ishikawa diagram is a graphic tool used by businesses which offers an overview of the causes and effects of a problem. By ranking the causes, the sources of the problem can be accurately identified.
Theory
Although the Ishikawa diagram is mainly used in business as a quality or project management tool, it also lends itself particularly well to risk management. Indeed, the diagram not only allows problems to be solved, but also anticipated. For example, when a business wants to put a project in place, it examines the aspects that could come into consideration if the project fails. By assessing the various elements that could cause the project to fail, the company knows exactly where to focus its attention to prevent the problem from actually materialising.


