Erhalten Sie Zugang zu diesem und mehr als 300000 Büchern ab EUR 5,99 monatlich.
- Herausgeber: Fernhurst Books Limited
- Kategorie: Fachliteratur
- Sprache: Englisch
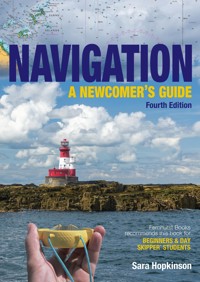
Get to grips with navigation at sea. This best-selling book gives you all the information you need to know to do just that! It starts from scratch, uses no jargon and features diagrams and pictures, instead of words, wherever possible. It covers all modern navigation and has been updated to reflect upcoming changes in Admiralty charts. It is recommended by Fernhurst Books for beginners and Day Skipper students. Written by an RYA Yachtmaster Instructor and Examiner who runs her own RYA Training Centre which specialises in navigation, it is the perfect place for newcomers to navigation to start. It explains simply how to look at charts (paper or digital), find your position, look at tides, plan your passage and determine the course to steer. It will help you find out where you are and how to get to where you want to.
Sie lesen das E-Book in den Legimi-Apps auf:
Seitenzahl: 133
Veröffentlichungsjahr: 2023
Das E-Book (TTS) können Sie hören im Abo „Legimi Premium” in Legimi-Apps auf:
Ähnliche


CONTENTS
WELCOME TO NAVIGATION
LOOKING AT CHARTS
Types Of Chart
Depths & Heights
GIVING A POSITION
Latitude & Longitude
Range & Bearing
FINDING YOUR POSITION
GNSS
A Fix
A DR Position
An Estimated Position
LOOKING AT TIDES
General Introduction
Tide Tables & Tidal Heights
Tidal Streams
Using Tidal Heights
SIERRA ON A PASSAGE
Pin Mill Towards Brightlingsea
COURSE TO STEER
The Basic Plot
... So Much More
PILOTAGE
The Buoyage System
The Plan
PASSAGE PLANNING
The Regulations
The Navigation Plan
LOOKING AT ELECTRICS
The Basics
Chart Plotters
SIERRA
The Passage Continued
NAVIGATION
To Sum Up
GLOSSARY
The Fernhurst Books’ Knowledge Centre has lots of other information (including videos, book extracts and other resources) on navigation – scan the QR code or visit www.fernhurstbooks.com & click on ‘Knowledge Centre’ to find out more
WELCOME TO NAVIGATION
Navigation is something we all do: it is simply finding the way around.
We negotiate the motorways and rail systems using maps and signs. We have learnt to read the maps, follow the signs, look out for landmarks and study timetables. We estimate how long the journey will take, allowing for the distance and the average speed that we expect to travel, and then add on a bit because of possible delays. If it is somewhere we have not been before we read up about it and talk to friends for advice. This is navigation.
The aim of this book is to help transfer these skills of navigation from the land to the sea.
Someone once said to me that there are only two questions in navigation:
Where am I?
Where do I go now?
While I agree with this generally, there are other background details that need to be included to help answer these two basic questions.
To help make the book easy to use the different subjects are colour-coded and the details are built up gradually.
Navigation is fun and remember – it can’t be that difficult because lots of people can do it!
Sara
Some of the vast range of electronic navigation equipment available.
LOOKING AT CHARTS
Types Of Chart
If you are interested in navigation at sea, start with a chart. Charts are the paper or digital maps of the sea and are full of fascinating details (not of the land or of the sea really, but of the coast and what lies beneath the water). Data has been gathered over many centuries by navigators and explorers and now satellite technology to enhance the accuracy. Look for the source data or Zone of Confidence information on a chart to see the date and reliability of the surveys used to produce it.
Source data / Zone of Confidence information
Charts concentrate on the details that are of interest to navigators such as:
• The depth of the water
•Hazards, like rocks and sandbanks
• Conspicuous features on the coastline
•Points of navigational importance like lighthouses and buoys
Many details on the land are omitted as not relevant.
Admiralty paper chart
The best chart to start studying is one of an area that you have sailed in or know from the land, and a paper chart is a good first choice.
Ordinary bookshops that sell maps do not generally sell charts, but most marina chandlers stock charts of the local area. Chart agents specialise in selling charts: they sell charts and navigation publications for the world.
There are a number of different types of charts.
Admiralty paper and digital charts are produced by an agency of the government, the UK Hydrographic Office (UKHO), for use throughout the world. Admiralty paper charts are likely to be withdrawn after 2030. All charts, paper or digital, become out of date quite quickly as depths change or buoys are moved. After you have bought the chart, it is down to you to keep it up to date. Information can be found on the Admiralty website on www.nmwebsearch.com.
For more information on any of the UKHO products go to https://msi.admiralty.co.uk
Imray paper charts are sold through chart agents and chandlers, or direct from the Imray website, and cover the UK, North West Europe, Mediterranean and Caribbean. Their charts come as single sheets or in bound or loose leaf folios. They are printed on a water-resistant paper. In many cases a free download of the digital version is included.
Imray chart folio
The folios contain about 10-20 charts in A2 format and cover the most popular boating areas, and updates are available on the Imray website. These are very good value and come in a strong plastic wallet and you get coverage at passage, coastal and harbour scales.
Imray also produce many pilot books and cruising guides of popular areas especially written for skippers of yachts and motor cruisers, whereas the Admiralty publications were originally intended for ship captains.
For more information and corrections, go to www.imray.com
Single Imray chart
Digital or electronic charts are popular and can be used with a computer, tablet or a dedicated plotter with an electronic display. As well as the Admiralty, private companies produce these charts. More about these later, but remember these need updating too.
Colne Bar: Imray electronic chart displayed on a tablet
Foreign charts are quite similar in appearance to UK charts, and worth considering. The Dutch charts of their inland waterways, for example, are full of detail and so popular that they can be bought in chandlers in the UK.
Many of the symbols used on charts are easy to guess but others have to be learnt ... it’s best to do this a few at a time as there are hundreds!
The UKHO publishes a fantastic book: Symbols and Abbreviations used on Admiralty Charts, often called 5011. This is a useful addition to every boat’s library. The information is published for Admiralty charts, but the symbols are largely common to all chart producers. A similar guide is available for Admiralty and official digital charts.
5011 / Symbols and Abbreviations used on Admiralty Charts, published by the UKHO
‘Understanding a Nautical Chart’, published by Fernhurst Books, also contains all the chart symbols from 5011
Many of the chart symbols are easy to guess as they are simply very small pictures of the real object. Each picture obviously takes up much more space on the paper than the real thing so a small circle in the baseline shows the actual position.
Many people starting their first navigation course immediately consider a new pair of glasses!
LOOKING AT CHARTS
Depths & Heights
Most charts, but not all, are now metric and instantly recognisable because they are so colourful … and say ‘DEPTHS IN METRES’ on the white margins at the top and bottom of the chart! This means that the depths of water and the heights of bridges and lighthouses are given in metres. On non-metric charts the depths are in feet and fathoms (6 feet equals 1 fathom) and the heights in feet.
Above: A non-metric chart
A metric chart
On comparison, the non-metric charts seem quite dull because the colours are mainly limited to black and white.
On Admiralty metric charts one of the main uses of colour is to make the different depths stand out vividly:
•Yellow is used to show the area above sea level – land!
•Green shows areas like beaches, rocks, mudflats and sandbanks which are sometimes covered by the water and sometimes not. These are known as drying areas
•Dark blue, light blue and then white show increasing depth of water
• These areas are separated by marine contour lines. Follow a contour line and somewhere along it will be written the number of metres that it represents
Don’t expect to find the shallow areas only along the coastline. The sandbanks of the Thames Estuary are famous, or infamous! The banks fan out to form a complicated maze of channels as the River Thames flows out into the North Sea. It is possible for a boat to be aground in the Thames Estuary but unable to see land at all, and in bad weather boats have been smashed to pieces on these dangerous banks. Similarly the Bramble Bank in the Solent has caught out many sailors who go aground close to the main shipping channel to Southampton Docks.
All these banks are clearly marked on the chart but skippers need to navigate with care and remember the old saying; “The nearest bit of land to you is usually the bit underneath the boat!”
Depth of water may be one of the most vital bits of information for navigators but it is not straightforward to show on a chart because the depth varies as the water goes up and down with the tide.
This problem is solved by relating the depths to chart datum as a theoretical level from which to start measuring.
Chart datum is usually defined as the lowest astronomical tide (astronomical since it is the positions of the sun and the moon that cause the movement of the water that we call tides). The level shown on the chart is therefore pessimistic – it shows the lowest level to which the water is expected to fall, except under extreme weather conditions or abnormal range of the tide. (The range of the tide is the amount the water has gone up or down between high water and low water.)
In other words, there is almost always some more water than is shown on the chart – at high water there is a lot more and at low water there is a little more. Showing the least depth ever expected increases the safety margin. The numbers written over the blue and white areas of the chart are the charted depths in metres, known as soundings. They are written without the use of a decimal point but show the figure for the decimal below the main number.
17
If it is necessary to know the actual depth of water at a particular spot then the height of tide would have to be added to the charted depth shown on the chart. (The height of tide is how much the water is above chart datum. For high water and low water height of tide can be found in tide tables. Height of tide between high water and low water can be calculated if necessary. See Figure 1.)
Figure 1: Depth of water (A)
Another feature associated with depth and shown by colour and figures is drying height. This is an area above chart datum, which therefore may ‘dry out’ or stick out above the water most of the time, some of the time or just occasionally. Drying heights are shown in green with the figures underlined showing the height in metres above chart datum (Figure 2).
05
18
above chart datum
Figure 2: Drying heights
These areas are found on the coast and where there are rocks or sandbanks, but again the height of the tide must be taken into account to calculate the real danger.
The height of tide must be applied to the drying height that is shown on the chart, and may cancel it out completely. The chart is being pessimistic again to increase the safety margin. Remember there is almost always more water than is shown on the chart.
This is a good thing up to a point. The green areas are not always above the level of the water, even though they are above the level of chart datum. Skippers can see them on the chart but not always by eye – if they could maybe fewer people would hit them! Sometimes there is no water over a sandbank at all and the seals may be sunning themselves, sometimes there is enough water to sail right over the bank quite safely, and sometimes there is water over the bank so that it cannot be seen … but not enough! All of this depends on the height of the tide (Figure 3).
Figure 3: Depth of water (B)
The colours and figures help the navigator to build up the ‘three dimensional’ image necessary to navigate in rivers, estuaries and coastal areas (Figure 3).
Is all information about heights given with reference to chart datum?
Well no, it is not. One exception is the height or elevation of a lighthouse. This is given with reference to MHWS (Mean High Water Springs) (Figure 4). MHWS is the height of the tide at the average, or mean, of the highest high tides, which are called spring tides. Spring tides occur all the year round, not just in spring! More about this later.
Above: Figure 4: Height of lighthouse from MHWS
Figure 5: Height of lighthouse from height of tide
Usually the height of the tide is lower than MHWS (Figure 5), so the lighthouse is in effect ‘taller’ than shown on the chart and so can be seen from further away (Figure 6).
Figure 6: Seeing a lighthouse
The second exception is the vertical clearance under a bridge or power-line. This is given with reference to HAT (highest astronomical tide) – the highest level to which the water is ever expected to rise under normal conditions. When the tide is lower the clearance will be greater (Figures 7 & 8).
The information given on the chart is again pessimistic, to increase the safety margin.
Above: Figure 7: Bridge elevation of HAT
Figure 8: Bridge elevation from height of tide
When taking a good look at a chart don’t miss the information shown in the notices. Somewhere on the chart is a panel of information about the chart itself, with special details and warnings for the local area. This information will include:
•The datum of the chart. This is the measuring system that was used to produce the chart. UK charts used to be marked OSGB 36 for Ordnance Survey of Great Britain 1936 but they are now all WGS84 meaning that they are based on the World Geodetic Survey of 1984.
Do you need to know this? Yes, to some extent. If a Global Navigation Satellite System, such as GPS, is used on the boat it will need to be set to the same datum as the chart to prevent inaccuracies. It is necessary to go into the main menu system to do this, and maybe read the instruction book!
•The buoyage system for the region. There are only two systems – Region A and Region B. North America, and other countries nearby, use Region B but everywhere else uses Region A. This will be dealt with later in the book. It’s not as confusing as it seems, but check up before that exotic charter or diving holiday!
•Projection. This is the method that was used to make the round world fit on a flat piece of paper. This has been a problem ever since the first charts were drawn and different solutions or projections are still used. All result in some distortions of scale.
•Local safety notes and warnings. It’s a good idea to read these: if they were not important they would not have been put on the chart in the first place!
GIVING A POSITION
Latitude & Longitude
Having looked at a chart and understood some of the symbols and colours, the next thing to tackle is position. The position is a description of an exact location


