Erhalten Sie Zugang zu diesem und mehr als 300000 Büchern ab EUR 5,99 monatlich.
- Herausgeber: Fernhurst Books Limited
- Kategorie: Fachliteratur
- Serie: Practical Companions
- Sprache: Englisch
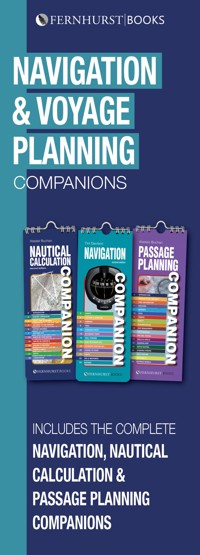
Fernhurst Books' compact, handy guides to navigating at sea, nautical calculations and passage planning bundled together in e-book form for the first time. The perfect quick reference guides to keep on your phone or tablet, easily accessible when you are on board. They contain all the essential information for when you need it most about navigating and passage planning. The Navigation Companion covers all the navigation essentials: charts, compass, tides, standard and secondary ports, dead reckoning, estimated position, course to steer, lights, GPS, waypoints and buoyage in a highly illustrated format making it easy to understand at a glance – ideal for those moments when you need an answer, and you need it fast! The Nautical Calculation Companion is an aide memoire of those calculations frequently needed (but often forgotten) for traditional coastal and offshore navigation and other equations and formulae which can be useful afloat. Each topic has worked examples, and there are frequent diagrams to illustrate the process. The Passage Planning Companion details the timetable for developing a passage plan and goes through all the elements you should consider: port information, routeing, weather, tides, timings and safety. It then takes you through ship management on the passage: the crew briefing, roles, routines, pre-sail checks, watch keeping and much more. This will be a valued companion when planning and executing a sea voyage.
Sie lesen das E-Book in den Legimi-Apps auf:
Seitenzahl: 75
Veröffentlichungsjahr: 2024
Das E-Book (TTS) können Sie hören im Abo „Legimi Premium” in Legimi-Apps auf:
Ähnliche


CONTENTS
NAVIGATION
CHARTS
LATITUDE & LONGITUDE
COMPASS
TIDES
STANDARD PORTS
SECONDARY PORTS
TIDAL STREAMS
DEAD RECKONING (DR)
ESTIMATED POSITION (EP)
COURSE TO STEER
LIGHTS
GPS & WAYPOINTS
BUOYAGE
NAUTICAL CALCULATION
INTRODUCTION
BEARING CONVERSION
SPEED, TIME & DISTANCE
DISTANCE TO THE HORIZON
DIPPING DISTANCE
DISTANCE OFF
NORTH BY YOUR WATCH
SAILING IN CURRENTS
SAILING TO WEATHER
WAVES & SWELL
DEPTH
CONVERSIONS
PASSAGE PLANNING
INTRODUCTION
PASSAGE PLAN TIMETABLE
PORT INFORMATION
ROUTEING
WEATHER
TIDES
TIMINGS
SAFETY
DOCUMENTATION
SHIP MANAGEMENT
CREW BRIEFING
PRE-SAIL CHECKS
DRILLS & SPILLS
ABANDON SHIP
WATCH KEEPING
STANDING ORDERS
DAILY ROUTINE
AND FINALLY...
DISTRESS SIGNALS
CHARTS
Some of the details shown on an Admiralty chart.
1. Catalogue number
2. Title – shows area covered
3. Units used for depth measurement – normally in metres but watch out for older charts still in fathoms
4. Scale of chart e.g. 1:75,000 – 1 unit of distance on chart equals 75,000 units on earth’s surface
5. Cautions – printed in magenta; contain important navigational warnings
6. Depths are referred to Chart Datum
7. Underlined figures are drying heights above Chart Datum; other heights are above Mean High Water Springs
8. IALA buoyage system, Region A – red to port when going into a harbour or estuary
9. Mercator projection – the method used to construct the chart
10. A larger scale chart is available of this area. You should always be working on the largest scale chart that is available
11. Latitude scale – use this scale, opposite your position, for distance measurements
12. Longitude scale
13. Small corrections (such as buoys being moved). The year and number of the Notice to Mariners containing the correction. Admiralty charts can be corrected by returning them to a Chart Agent, or by yourself referring to the weekly Leisure Notice to Mariners available online
14. Edition date – date this edition of chart was published; the chart may be latest available although published several years previously
15. Tidal stream data – this gives tidal rate and set for hours before and after High Water at a Standard Port
CHART SYMBOLS
Admiralty Chart 5011 is actually a book showing all the chart symbols (which is reproduced in Fernhurst Books’ Understanding a Nautical Chart). Here we will just concentrate on some common dangers such as rocks and shallows. You must know these:
LATITUDE & LONGITUDE
Parallels of latitude
Meridians of longitude
0° goes through Greenwich. E and W are measured from there (up to 180°) e.g. 10° 25’.37 E
Position
Position is given as lat (first) and long, e.g. the position of North Foreland Light is 51° 22’.47 N 001° 26’.80 E
Alternatively, position can be given as a (true) bearing and distance from a known point, e.g., 095° North Foreland Light 5 miles
Distance
Note: Speed is measured in knots
FINDING LATITUDE & LONGITUDE OF A POINT ON THE CHART
1. To find the latitude, use the dividers to measure from a horizontal line to the point
2. Now move the open dividers to the latitude scale, align to the horizontal line and read off the latitude (here, it is 50° 16.3’N)
3. Find the longitude in a similar way
4. Here, it is 3° 57.7’W
TRANSFERING LATITUDE & LONGITUDE TO THE CHART
1. To transfer 50° 16.3’N 3° 57.7’W, first open the dividers like this
2. Move the dividers to roughly the correct latitude and draw a line like this
3. Now set the dividers for the longitude
4. Transfer to the line already drawn and mark the longitude. The intersection is 50° 16.3’N 3° 57.7’W
COMPASS
VARIATION
DEVIATION
Theoretically the needle in a magnetic compass points to magnetic North, but the compass in most boats is subject to magnetic interference from the engine, the electrics and electronics.
Any error caused is known as deviation.
• Deviation is the angle between a magnetic bearing and the same bearing taken by a particular compass in a particular boat
• Unlike variation, deviation varies according to the boat’s heading. To see why this is, imagine that all the ‘interference’ in a boat behaves as though it is concentrated into a fixed iron block
In practice deviation is often reduced to a minimum or removed altogether by a compass adjuster. He will swing the compass to find out the deviation on various headings, then place magnets to remove or reduce it. He will then produce a Deviation Table for you.
CONVERTING BEARINGS
When you are tired & hurried and switching between true & magnetic bearings it is easy to become confused and begin to wonder if you add or subtract variation. The order is:
Some remember this with:
Cadbury Dairy Milk Very Tasty
The rule is:
Magnetic to True
ADD
Easterly Variation
Magnetic to True
SUBTRACT
Westerly Variation
True to Magnetic
SUBTRACT
Easterly Variation
True to Magnetic
ADD
Westerly Variation
A popular mnemonic is:
So this, & the corollaries, are:
Compass to True
ADD
Easterly Variation
Compass to True
SUBTRACT
Westerly Variation
True to Compass
SUBTRACT
Easterly Variation
True to Compass
ADD
Westerly Variation
For example:
Error is the sum of Variation and Deviation
With a handbearing compass, cautiously assume deviation is zero. Check by continuously taking a bearing with the handbearing compass on a distant object, while turning the boat through 360°.
TIDES
RISE & FALL OF THE TIDE
In most areas there is a High Water and a Low Water every 12 hours 20 minutes.
The size of the rise and fall varies from area to area: it might be 12m in the Bristol Channel, 4m off Harwich.
• Spring tides (springs) occur when the sun and moon are in line, relative to the earth. This happens two days after new and full moon. At springs the high tides are higher and the low tides are lower. Highest spring tides occur around 21 March and 23 September at the Vernal and Autumnal Equinoxes
• Neap tides (neaps) occur when sun and moon are offset, midway between full and new moon. The rise and fall is smallest
• Range of the tide is the difference in height between successive high and low waters
• Chart datum (CD) is the level to which soundings and drying heights on a chart are referred. In practice it is the lowest height to which the tide is ever expected to fall (LAT)
• Charted depth is the actual sounding shown on a chart, being the depth of the sea bed below chart datum, and the least depth expected to occur in that place under normal conditions
• Actual depth – at any time, is what it says, and is the charted depth plus the height of the tide, as obtained from Tide Tables
• Drying height is the height above chart datum of any feature that is occasionally covered
• Duration (of the tide) – the time between HW and the previous LW
• Mean High Water Springs (MHWS) – the average height of all the spring highs
• Mean Low Water Springs (MLWS) – the average height of all the spring lows
• Mean High Water Neaps (MHWN) – the average height of all the neap highs
• Mean Low Water Neaps (MLWN) – the average height of all the neap lows
TIDE TABLES
In almanacs and Admiralty tide tables, times and heights of HW and LW are given each day for a number of large ports known as Standard Ports. Other smaller ports are listed as Secondary Ports (see page 12). Local tide tables are available for many individual ports.
Tide tables are in this form and are given in UT (GMT) for British waters. In summer in the UK add 1 hour for DST (Daylight Saving Time: BST).
Tide tables for continental ports show local standard time, and in summer 1 hour is added for DST. They also show the correction to convert to UT. The Netherlands, Belgium and France use CET, or Time Zone – 0100. This means that 1 hour must be subtracted from the time in the table to convert to UT.
STANDARD PORTS
Tide tables give times and heights of HW and LW for a Standard Port. Intermediate heights and times are deduced from the accompanying curve.
Range is 4.9m nearer springs
What is the height of tide at Dover at 1600?
1. On the Dover tidal diagram plot heights of HW and LW each side of the required time and join them up (red line)
2. Enter the HW time and other times as necessary in the boxes below the curves
3.


