17,99 €
Mehr erfahren.
- Herausgeber: John Wiley & Sons
- Kategorie: Fachliteratur
- Sprache: Englisch
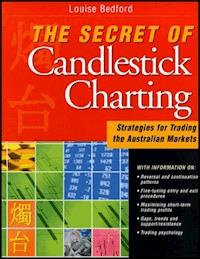
Most traders on the ASX are familiar with line and bar charts, but there has never before been a book written in Australia on the ancient Japanese art of candlestick charting. Louise Bedford, author of the highly successful The Secret of Writing Options, writes in a clear, concise way and uses plenty of examples to help readers understand candlesticks and use them to profitably trade the markets.
Sie lesen das E-Book in den Legimi-Apps auf:
Seitenzahl: 250
Veröffentlichungsjahr: 2016
Ähnliche


Table of Contents
Cover
Title page
Copyright page
Acknowledgments
PART I: Candlestick Pattern Secrets
Chapter 1 Let’s Get Started
WHY USE CANDLESTICKS?
A QUICK HISTORY LESSON
READING GUIDE
CANDLES, LINE CHARTS AND BAR CHARTS
OPEN AND CLOSE
OTHER TIMEFRAMES
THE WHITE CANDLE
THE BLACK CANDLE
WHEN TO USE CANDLESTICKS
THE ELEMENTS OF THE CANDLE
CHAPTER REVIEWS
Chapter 2 Single-Line Candle Reversal Patterns
A WORD ON CONFIRMATION . . .
THE SHOOTING STAR
THE HAMMER
THE INVERTED HAMMER
THE HANGING MAN
THE DOJI
THE SPINNING TOP
OTHER TYPES OF CANDLES
THE MARUBOZU OR SHAVEN CANDLE
THE SHORT CANDLE
THE LONG AND DOMINANT CANDLE
REJECTION PATTERNS
BEARISH REJECTION
BULLISH REJECTION
Chapter 3 Two-Line Candle Reversal Patterns
BACK-TESTING
THE THREE-POINT BACK-TESTING PLAN
THE BEARISH ENGULFING PATTERN
THE BULLISH ENGULFING PATTERN
EXAMPLE
DARK CLOUD COVER
THE PIERCING PATTERN
HARAMI
HARAMI CROSS
OTHER INSTRUMENTS
Chapter 4 Three-Line Candle Reversal Patterns
THE EVENING STAR
THE MORNING STAR
THE EVENING AND MORNING DOJI STARS
TWO CROWS
Chapter 5 Trading Concepts and Continuation Patterns
OPPORTUNITY IDENTIFICATION
PLACING THE ORDER
MONEY AND RISK MANAGEMENT
CONTINUATION PATTERNS
UPSIDE TASUKI GAP
DOWNSIDE TASUKI GAP
RISING THREE METHOD
FALLING THREE METHOD
FINAL THOUGHTS ON CONTINUATION PATTERNS
PART II: Analysis Secrets
Chapter 6 Candles and Gaps
EXAMPLE
GAPS AS SUPPORT
GAPS AS RESISTANCE
TRAPS FOR NEW PLAYERS
Chapter 7 Support and Resistance
TRENDLINES
WHERE TO DRAW YOUR LINE
SUPPORT AND RESISTANCE CANDLES
SOME NEW PATTERNS
TWEEZER TOP
TWEEZER BOTTOM
UPTHRUSTS
SPRINGS
DOMINANT CANDLES, MID-POINTS AND CHANGE OF POLARITY
THE DOMINANT WHITE CANDLE
THE DOMINANT BLACK CANDLE
THE IMPORTANCE OF THE MID-POINT
CHANGE OF POLARITY
PSYCHOLOGICALLY SIGNIFICANT NUMBERS
Chapter 8 Western Techniques and Candles
WESTERN TECHNIQUES
MOVING AVERAGES
MOMENTUM
CONSOLIDATION AND MOMENTUM INDICATORS
THE SIROC
RELATIVE STRENGTH COMPARISON
TOP DOWN ANALYSIS
BOTTOM UP ANALYSIS
PUTTING IT ALL TOGETHER
HOW I USE THE RELATIVE STRENGTH COMPARISON
Chapter 9 Share Stages
STAGES
SUMMARY
BREAKOUT STRATEGY
OPPORTUNITY IDENTIFICATION
AN ALTERNATIVE PATTERN
CHANGES IN BEHAVIOUR
PATTERNS THAT CONFIRM A BREAKOUT
ANOTHER CHANCE TO ENTER THE TRADE
SEARCHING PROCEDURES
REAL-TIME SYSTEMS
PART III: Trading Secrets
Chapter 10 A Kindred Spirit
Chapter 11 Seven Golden Candlestick Rules
Further Education
Glossary
Index
Also by Louise Bedford
The Secret of Writing Options
Trading Secrets
Charting Secrets
First published in 2000 by Wrightbooks
an imprint of John Wiley & Sons Australia, Ltd
42 McDougall Street, Milton Qld 4064
Office also in Melbourne
© Louise Bedford 2005
The moral rights of the author have been asserted
National Library of Australia Cataloguing-in-Publication data
Bedford, Louise.
The secret of candlestick charting: strategies for trading the Australian markets.
Includes index.
ISBN: 1 876627 28 X.
1. Stocks - Prices - Australia - Charts, diagrams, etc.
2. Commodity exchanges - Charts, diagrams, etc.
3. Speculation - Australia.
4. Stock price forecasting.
5. Securities - Australia.
I. Title.
332.632280994
All rights reserved. Except as permitted under the Australian Copyright Act 1968 (for example, a fair dealing for the purposes of study, research, criticism or review), no part of this book may be reproduced, stored in a retrieval system, communicated or transmitted in any form or by any means without prior written permission. All inquiries should he made to the publisher at the address above.
Cover design by Rob Cowpe
Disclaimer
The material in this publication is of the nature of general comment only, and neither purports nor intends to he advice. Readers should not act on t lie basis of any matter in this publication without considering (and if appropriate taking) professional advice with due regard to their own particular circumstances. The author and publisher expressly disclaim all and any liability to any person, whether a purchaser of this publication or not, in respect of anything and of the consequences of anything done or omitted to be done by any such person in reliance, whether in whole or in part, upon the whole or any part of the contents of this publication.
Acknowledgments
The generosity of significant players in the market never ceases to amaze me! In particular Daniel Gramza, Martin Pring, David Chia, Harry Stanton and Chris Tate (www.artoftrading.com.au) have been incredibly supportive and offered practical advice and suggestions for putting together this publication. All of these men have already established outstanding reputations in the trading industry, so they have very little to gain by being interviewed for this book, or offering an appropriate word of encouragement. Their support has refreshed my view of human nature!
Gary Stone and the team at ShareFinder Investment Services supplied the Market Master software that I used to create the charts in Chapter 8. Gary’s knowledge of the relative strength comparison and the SIROC indicator has greatly assisted my own trading results. ShareFinder can he contacted at PO Box 7374, Beaumaris, Victoria, 3193. Ph: 1300 STOCKS. You can access a free demonstration disk of Market Master software by referring to www.sharefinder.com.au.
Chris Bedford, my husband, edited and corrected much of the finer detail of this book. His patience is greatly appreciated.
Thanks to The Trading Game Pty Ltd for providing the data required to create the charts throughout this publication. For more information about data, share trading, training and education, refer to www.tradinggame.com.au.
For more information about candlestick charting, please refer to my website www.tradingsecrets.com.au.
PART I Candlestick Pattern Secrets
Chapter 1
Let’s Get Started
Have you ever seen one of those ‘magic eye’ computer-generated three-dimensional pictures? At first glance it seems to be one-dimensional and quite flat in appearance. However, when you squint and stare at the picture for long enough, an incredible three-dimensional object reveals itself in vivid detail! “Oh, I can see it! It’s a space ship with little aliens inside … it’s amazing,” you exclaim, while the poor person beside you says dejectedly, “Where? Where? I can’t see a thing … ”
Once you know the trick of seeing the images, all of a sudden you can see them easily and everywhere, much to the frustration of your less-enlightened friends. The method of accessing the hidden image is almost impossible to explain until you can do it yourself.
Candlestick charting is very similar. Once you can see the information in the chart, you will probably never want to look at another type of chart again. You will excitedly talk about ‘dark cloud cover’ and ‘raindrops’ until your friends begin to think that you have taken a second job at the weather bureau.
You are about to discover a technique that has the potential to completely alter the way you view charting, yet is complementary to all of the other methods of technical analysis you might use. Technical analysis is defined as the examination of price and volume action on a chart. I predominantly use technical indicators to reach conclusions about the likely direction of share price activity, rather than relying on fundamental data (e.g. balance sheet items such as profit and loss).
Lesen Sie weiter in der vollständigen Ausgabe!
Lesen Sie weiter in der vollständigen Ausgabe!
Lesen Sie weiter in der vollständigen Ausgabe!
Lesen Sie weiter in der vollständigen Ausgabe!
Lesen Sie weiter in der vollständigen Ausgabe!
Lesen Sie weiter in der vollständigen Ausgabe!
Lesen Sie weiter in der vollständigen Ausgabe!
Lesen Sie weiter in der vollständigen Ausgabe!
Lesen Sie weiter in der vollständigen Ausgabe!
Lesen Sie weiter in der vollständigen Ausgabe!
Lesen Sie weiter in der vollständigen Ausgabe!
Lesen Sie weiter in der vollständigen Ausgabe!
Lesen Sie weiter in der vollständigen Ausgabe!
Lesen Sie weiter in der vollständigen Ausgabe!
Lesen Sie weiter in der vollständigen Ausgabe!


